Engineering is a program of study at University of Nevada - Reno. The school offers a bachelor’s degree in the area. We’ve gathered data and other essential information about the bachelor’s degree program in engineering, such as if the program is offered online, ethnicity of students, how many students graduated in recent times, and more.
If there’s something special you’re looking for, you can use one of the links below to find it:
If you're having trouble deciding which school is best for you, you may want to check out our many college rankings. The bachelor's program at UNR was ranked #231 on College Factual's Best Schools for engineering list. It is also ranked #1 in Nevada.
Here are some of the other rankings for UNR.
Out-of-state part-time undergraduates at UNR paid an average of $530 per credit hour in 2019-2020. The average for in-state students was $263 per credit hour. The average full-time tuition and fees for undergraduates are shown in the table below.
| In State | Out of State | |
|---|---|---|
| Tuition | $7,901 | $23,554 |
| Fees | $794 | $794 |
| Books and Supplies | $1,300 | $1,300 |
| On Campus Room and Board | $12,216 | $12,216 |
| On Campus Other Expenses | $4,370 | $4,370 |
Learn more about UNR tuition and fees.
Online degrees for the UNR engineering bachelor’s degree program are not available at this time. To see if the school offers distance learning options in other areas, visit the UNR Online Learning page.
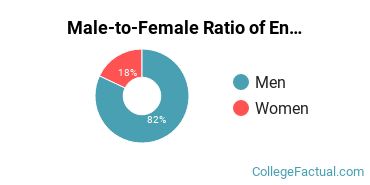
Women made up around 18.0% of the engineering students who took home a bachelor’s degree in 2019-2020. This is less than the nationwide number of 23.9%.
Around 34.7% of engineering bachelor’s degree recipients at UNR in 2019-2020 were awarded to racial-ethnic minorities*. This is higher than the nationwide number of 31%.
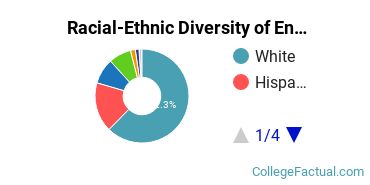
| Race/Ethnicity | Number of Students |
|---|---|
| Asian | 37 |
| Black or African American | 6 |
| Hispanic or Latino | 82 |
| Native American or Alaska Native | 1 |
| Native Hawaiian or Pacific Islander | 4 |
| White | 298 |
| International Students | 8 |
| Other Races/Ethnicities | 42 |
Engineering students may decide to major in one of the following focus areas.
| Focus Area | Annual Graduates |
|---|---|
| Biomedical Engineering | 6 |
| Chemical Engineering | 26 |
| Civil Engineering | 92 |
| Computer Engineering | 103 |
| Electrical Engineering | 44 |
*The racial-ethnic minorities count is calculated by taking the total number of students and subtracting white students, international students, and students whose race/ethnicity was unknown. This number is then divided by the total number of students at the school to obtain the racial-ethnic minorities percentage.
More about our data sources and methodologies.
