
College Factual analyzes over 2,000 colleges and universities in its annual rankings and ranks them in a variety of ways, including most diverse, best overall quality, best for non-traditional students, and much more.
University of New Haven was awarded 18 badges in the 2025 rankings. The highest ranked major at the school is criminal justice & corrections.
Explore the best ranked schools for the programs you are most interested in.
University of New Haven landed the #317 spot in College Factual's 2025 ranking of best overall colleges in the United States. The higher ed experts analyzed 2,152 colleges and universities across the nation to determine this ranking. This puts it in the top 20% of all schools in the nation. This is an improvement over the previous year, when University of New Haven held the #698 spot on the Best Overall Colleges list.
University of New Haven is also ranked #8 out of 18 schools in Connecticut.
University of New Haven has an acceptance rate of 91%, so it is easier to gain admission to this school than some others. Still, the admissions staff will examine your application closely to make sure you're a good fit for University of New Haven.
About 34% of students accepted to University of New Haven submitted their SAT scores. When looking at the 25th through the 75th percentile, SAT Evidence-Based Reading and Writing scores ranged between 550 and 640. Math scores were between 540 and 630.
At University of New Haven, the student to faculty ratio is 19 to 1. Compared to the national average of 15 to 1, this is somewhat high. This could mean that class sizes may be larger than they are at other colleges or universities or that professors may be required to teach more classes.
Another measure that is often used to estimate how much access students will have to their professors is how many faculty members are full-time. The idea here is that part-time faculty tend to spend less time on campus, so they may not be as available to students as full-timers.
The full-time faculty percentage at University of New Haven is 35%. This is lower than the national average of 47%.
University of New Haven has a freshmen retention rate of 74%. That's a good sign that full-time students like the school and their professors enough to want to stick around for another year. It's also a sign that the admissions team did a good job in choosing applicants who were a good fit for the school.
The on-time graduation rate for someone pursuing a bachelor's degree is typically four years. This rate at University of New Haven for first-time, full-time students is 55%, which is better than the national average of 33.3%.
Find out more about the retention and graduation rates at University of New Haven.
During the 2017-2018 academic year, there were 5,097 undergraduates at University of New Haven with 4,837 being full-time and 260 being part-time.
| $0-30 K | $30K-48K | $48-75 | $75-110K | $110K + |
|---|---|---|---|---|
| $28,032 | $29,547 | $30,939 | $34,186 | $35,968 |
The net price is calculated by adding tuition, room, board and other costs and subtracting financial aid.Note that the net price is typically less than the published for a school. For more information on the sticker price of University of New Haven, see our tuition and fees and room and board pages.
It's not uncommon for college students to take out loans to pay for school. In fact, almost 66% of students nationwide depend at least partially on loans. At University of New Haven, approximately 95% of students took out student loans averaging $10,248 a year. That adds up to $40,992 over four years for those students.
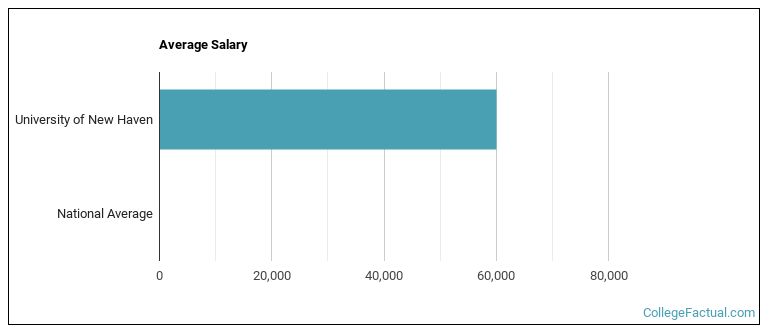
See which majors at University of New Haven make the most money.
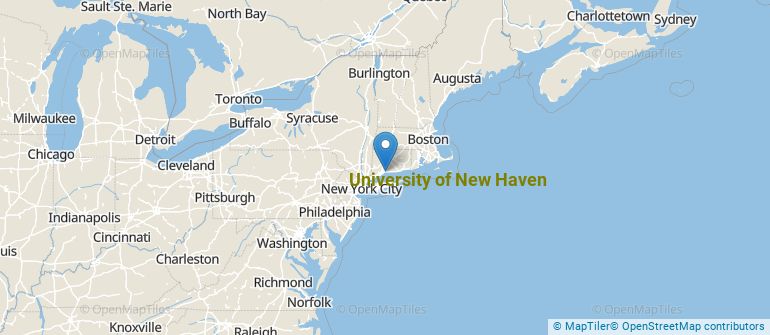
Get more details about the location of University of New Haven.
Contact details for University of New Haven are given below.
| Contact Details | |
|---|---|
| Address: | 300 Boston Post Road, West Haven, CT 06516-1916 |
| Phone: | 203-932-7000 |
| Website: | www.newhaven.edu/ |
| Most Popular Majors | Bachelor’s Degrees | Average Salary of Graduates |
|---|---|---|
| Criminal Justice & Corrections | 473 | $36,455 |
| Security Science and Technology | 218 | $40,889 |
| Business Administration & Management | 128 | $34,106 |
| Other Homeland Security | 89 | $42,455 |
| General Psychology | 83 | $29,108 |
| Computer Information Systems | 81 | NA |
| Health & Medical Administrative Services | 63 | NA |
| Dental Support Services | 62 | $59,086 |
| Management Sciences & Quantitative Methods | 45 | NA |
| Communication & Media Studies | 44 | $27,918 |
Online learning is becoming popular at even the oldest colleges and universities in the United States. Not only are online classes great for returning adults with busy schedules, they are also frequented by a growing number of traditional students.
In 2022-2023, 5,703 students took at least one online class at University of New Haven. This is an increase from the 5,398 students who took online classes the previous year.
| Year | Took at Least One Online Class | Took All Classes Online |
|---|---|---|
| 2022-2023 | 5,703 | 1,035 |
| 2021-2022 | 5,398 | 872 |
| 2020-2021 | 2,609 | 500 |
| 2018-2019 | 1,400 | 347 |
Learn more about online learning at University of New Haven.
If you’re considering University of New Haven, here are some more schools you may be interested in knowing more about.
Curious on how these schools stack up against University of New Haven? Pit them head to head with College Combat, our free interactive tool that lets you compare college on the features that matter most to you!
Footnotes
*The racial-ethnic minorities count is calculated by taking the total number of students and subtracting white students, international students, and students whose race/ethnicity was unknown. This number is then divided by the total number of students at the school to obtain the racial-ethnic minorities percentage.
References
More about our data sources and methodologies.