Here, you'll find out more about the major, including such details as the number of graduates, what degree levels are offered, ethnicity of students, and more. We've also included details on how UPenn ranks compared to other colleges offering a major in ee.
Go directly to any of the following sections:
UPenn is in the top 10% of the country for ee. More specifically it was ranked #20 out of 281 schools by College Factual. It is also ranked #2 in Pennsylvania.
During the 2021-2022 academic year, University of Pennsylvania handed out 22 bachelor's degrees in electrical engineering. This is a decrease of 15% over the previous year when 26 degrees were handed out.
In 2022, 75 students received their master’s degree in ee from UPenn. This makes it the #31 most popular school for ee master’s degree candidates in the country.
In addition, 15 students received their doctoral degrees in ee in 2022, making the school the #45 most popular school in the United States for this category of students.
Part-time undergraduates at UPenn paid an average of $1,871 per credit hour in 2022-2023. This tuition was the same for both in-state and out-of-state students. The average full-time tuition and fees for undergraduates are shown in the table below.
| In State | Out of State | |
|---|---|---|
| Tuition | $58,620 | $58,620 |
| Fees | $7,484 | $7,484 |
| Books and Supplies | $1,358 | $1,358 |
| On Campus Room and Board | $18,496 | $18,496 |
| On Campus Other Expenses | $3,070 | $3,070 |
Learn more about UPenn tuition and fees.
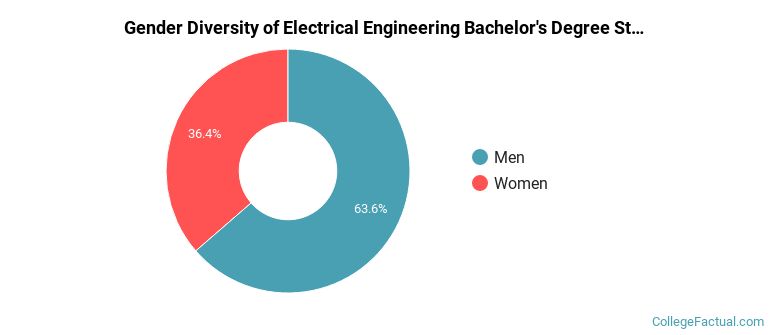
During the 2021-2022 academic year, 22 students graduated with a bachelor's degree in ee from UPenn. About 64% were men and 36% were women.
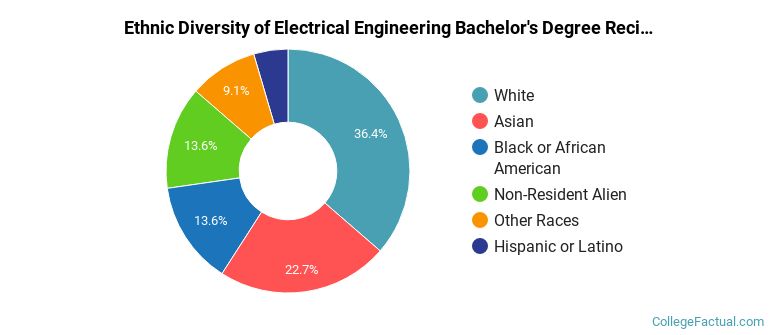
The following table and chart show the ethnic background for students who recently graduated from University of Pennsylvania with a bachelor's in ee.
| Ethnic Background | Number of Students |
|---|---|
| Asian | 5 |
| Black or African American | 3 |
| Hispanic or Latino | 1 |
| White | 8 |
| Non-Resident Aliens | 3 |
| Other Races | 2 |
Online degrees for the UPenn ee bachelor’s degree program are not available at this time. To see if the school offers distance learning options in other areas, visit the UPenn Online Learning page.
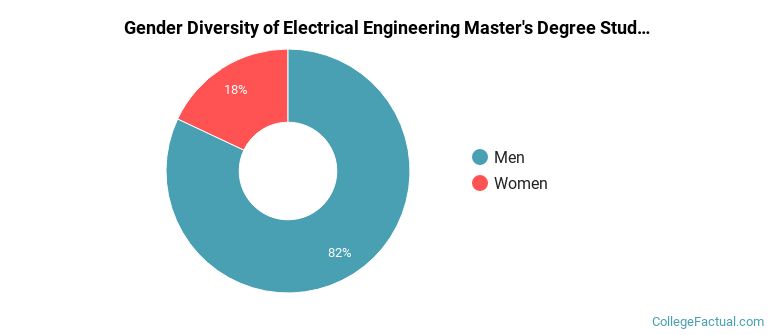
The ee program at UPenn awarded 50 master's degrees in 2021-2022. About 82% of these degrees went to men with the other 18% going to women.
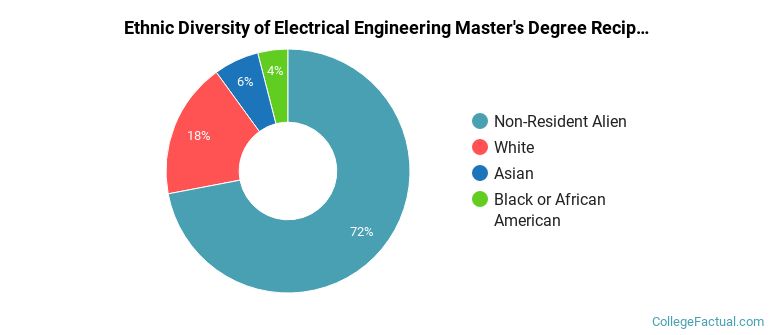
The following table and chart show the ethnic background for students who recently graduated from University of Pennsylvania with a master's in ee.
| Ethnic Background | Number of Students |
|---|---|
| Asian | 3 |
| Black or African American | 2 |
| Hispanic or Latino | 0 |
| White | 9 |
| Non-Resident Aliens | 36 |
| Other Races | 0 |
Take a look at the following statistics related to the make-up of the ee majors at University of Pennsylvania.
| Related Major | Annual Graduates |
|---|---|
| Biomedical Engineering | 121 |
| Mechanical Engineering | 112 |
| Materials Engineering | 84 |
| Chemical Engineering | 76 |
| Systems Engineering | 66 |
More about our data sources and methodologies.