We've pulled together some essential information you should know about the program, including how many students graduate each year, the ethnic diversity of these students, average starting salaries, and more. Also, learn how UPenn ranks among other schools offering degrees in history.
Jump to any of the following sections:
Ranked at #3 in College Factual's most recent rankings, UPenn is in the top 1% of the country for history students pursuing a bachelor's degree. It is also ranked #1 in Pennsylvania.
During the 2020-2021 academic year, University of Pennsylvania handed out 53 bachelor's degrees in history. This is a decrease of 17% over the previous year when 64 degrees were handed out.
In 2021, 7 students received their master’s degree in history from UPenn. This makes it the #127 most popular school for history master’s degree candidates in the country.
In addition, 11 students received their doctoral degrees in history in 2021, making the school the #16 most popular school in the United States for this category of students.
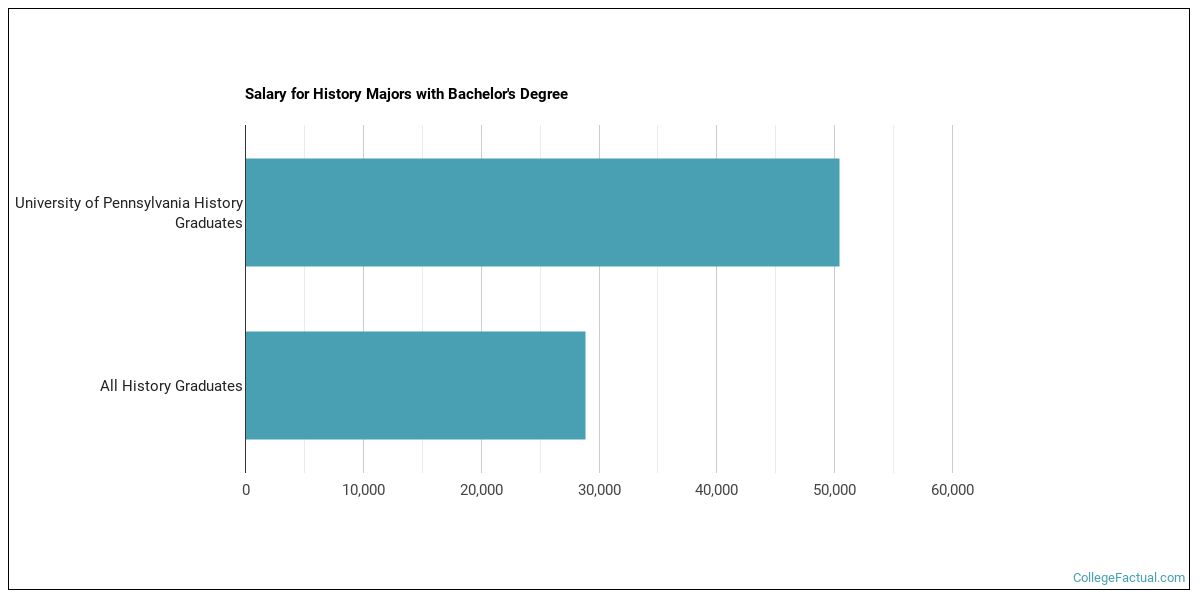
The median salary of history students who receive their bachelor's degree at UPenn is $50,380. This is higher than $28,881, which is the national median for all history bachelor's degree recipients.
While getting their bachelor's degree at UPenn, history students borrow a median amount of $11,000 in student loans. This is not too bad considering that the median debt load of all history bachelor's degree recipients across the country is $24,952.

Learn about other programs related to History that might interest you.
The online Master of Arts in History degree program can deepen your understanding of how history is made.
Take a look at the following statistics related to the make-up of the history majors at University of Pennsylvania.
During the 2020-2021 academic year, 53 students graduated with a bachelor's degree in history from UPenn. About 49% were men and 51% were women.

The majority of the students with this major are white. About 57% of 2021 graduates were in this category.
The following table and chart show the ethnic background for students who recently graduated from University of Pennsylvania with a bachelor's in history.

| Ethnic Background | Number of Students |
|---|---|
| Asian | 4 |
| Black or African American | 5 |
| Hispanic or Latino | 5 |
| White | 30 |
| Non-Resident Aliens | 7 |
| Other Races | 2 |
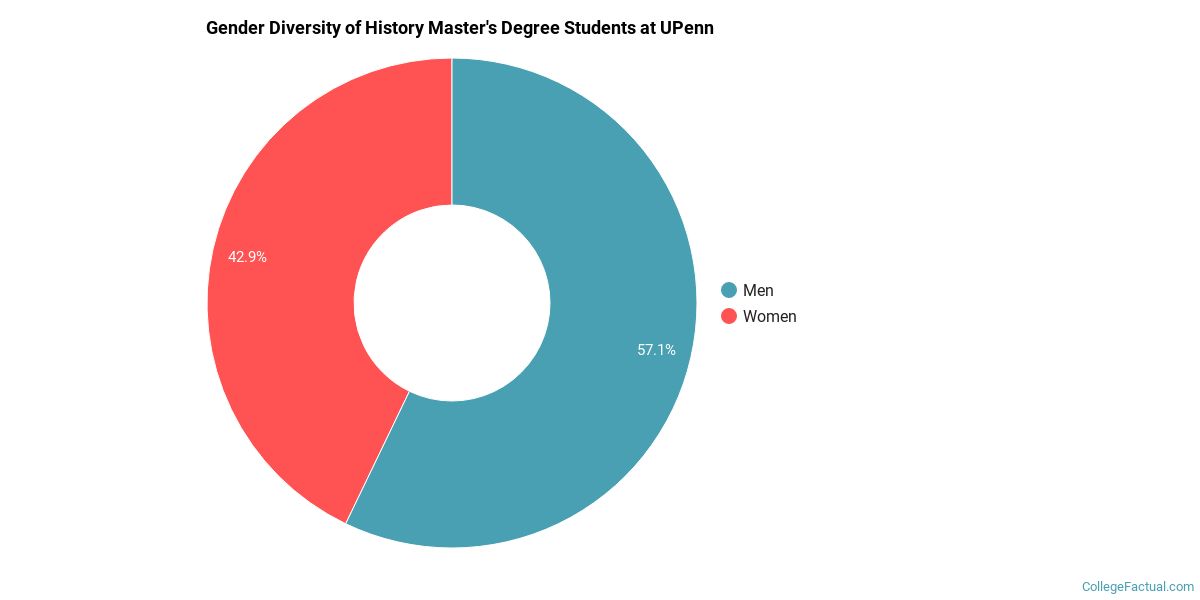
During the 2020-2021 academic year, 7 students graduated with a bachelor's degree in history from UPenn. About 57% were men and 43% were women.
The majority of the students with this major are white. About 86% of 2021 graduates were in this category.
The following table and chart show the ethnic background for students who recently graduated from University of Pennsylvania with a master's in history.

| Ethnic Background | Number of Students |
|---|---|
| Asian | 1 |
| Black or African American | 0 |
| Hispanic or Latino | 0 |
| White | 6 |
| Non-Resident Aliens | 0 |
| Other Races | 0 |
More about our data sources and methodologies.

