Jump to any of the following sections:
In College Factual's most recent rankings for the best schools for exercise science majors, University of Virginia came in at #15. This puts it in the top 5% of the country in this field of study. It is also ranked #1 in Virginia.
During the 2020-2021 academic year, University of Virginia - Main Campus handed out 84 bachelor's degrees in exercise science and kinesiology. This is an increase of 15% over the previous year when 73 degrees were handed out.
In 2021, 33 students received their master’s degree in exercise science from University of Virginia. This makes it the #16 most popular school for exercise science master’s degree candidates in the country.
Take a look at the following statistics related to the make-up of the exercise science majors at University of Virginia - Main Campus.
The exercise science program at University of Virginia awarded 84 bachelor's degrees in 2020-2021. About 19% of these degrees went to men with the other 81% going to women.

The majority of the students with this major are white. About 63% of 2021 graduates were in this category.
The following table and chart show the ethnic background for students who recently graduated from University of Virginia - Main Campus with a bachelor's in exercise science.
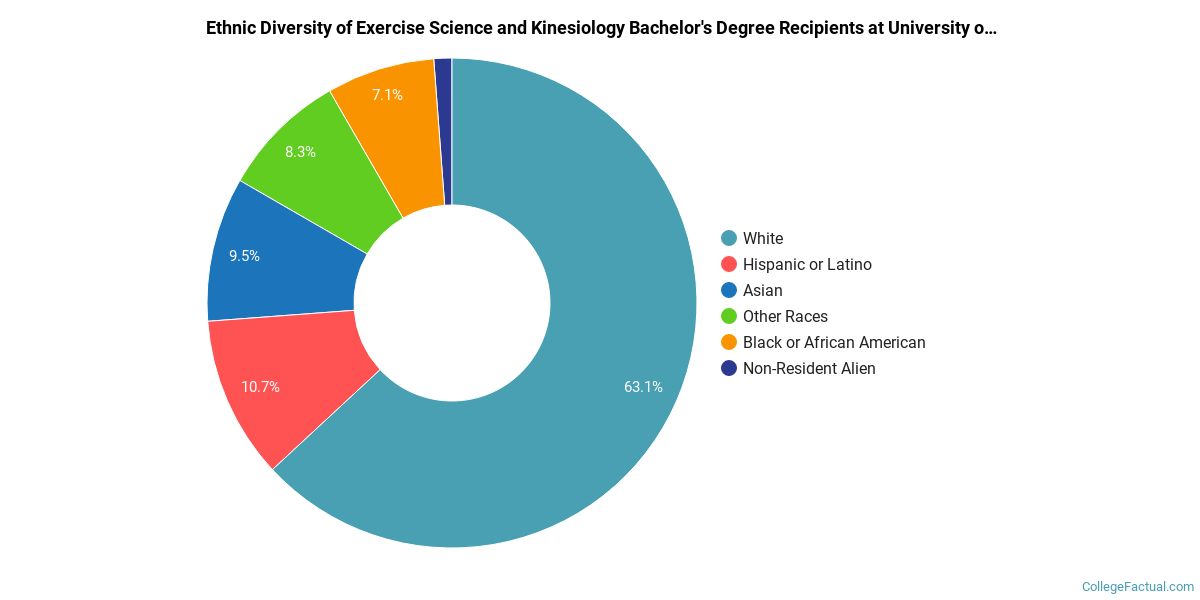
| Ethnic Background | Number of Students |
|---|---|
| Asian | 8 |
| Black or African American | 6 |
| Hispanic or Latino | 9 |
| White | 53 |
| Non-Resident Aliens | 1 |
| Other Races | 7 |
In the 2020-2021 academic year, 33 students earned a master's degree in exercise science from University of Virginia. About 55% of these graduates were women and the other 45% were men.

The majority of master's degree recipients in this major at University of Virginia are white. In the most recent graduating class for which data is available, 76% of students fell into this category.
The following table and chart show the ethnic background for students who recently graduated from University of Virginia - Main Campus with a master's in exercise science.

| Ethnic Background | Number of Students |
|---|---|
| Asian | 2 |
| Black or African American | 4 |
| Hispanic or Latino | 1 |
| White | 25 |
| Non-Resident Aliens | 0 |
| Other Races | 1 |
More about our data sources and methodologies.
