We've pulled together some essential information you should know about the program, including how many students graduate each year, the ethnic diversity of these students, average starting salaries, and more. In addition, we cover how University of West Georgia ranks in comparison to other schools with communication sciences programs.
Jump to any of the following sections:
The bachelor's program at University of West Georgia was ranked #271 on College Factual's Best Schools for communication sciences list. It is also ranked #5 in Georgia.
During the 2021-2022 academic year, University of West Georgia handed out 44 bachelor's degrees in communication sciences. This is an increase of 2% over the previous year when 43 degrees were handed out.
In 2022, 29 students received their master’s degree in communication sciences from University of West Georgia. This makes it the #139 most popular school for communication sciences master’s degree candidates in the country.
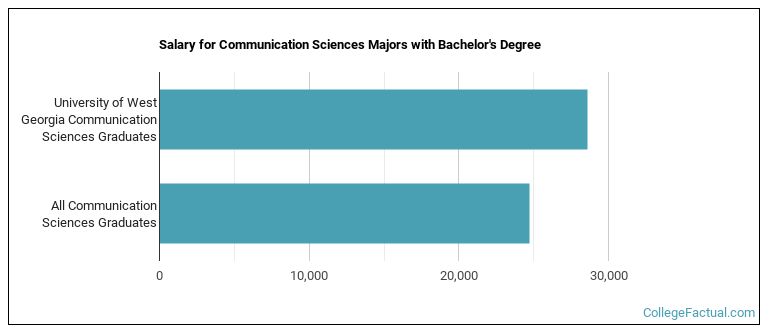
The median salary of communication sciences students who receive their bachelor's degree at University of West Georgia is $28,612. This is higher than $24,702, which is the national median for all communication sciences bachelor's degree recipients.
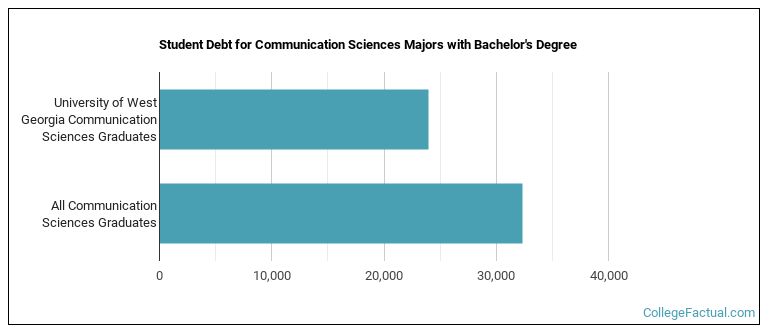
While getting their bachelor's degree at University of West Georgia, communication sciences students borrow a median amount of $23,950 in student loans. This is not too bad considering that the median debt load of all communication sciences bachelor's degree recipients across the country is $32,302.
The typical student loan payment of a bachelor's degree student from the communication sciences program at University of West Georgia is $203 per month.
Out-of-state part-time undergraduates at University of West Georgia paid an average of $643 per credit hour in 2022-2023. The average for in-state students was $182 per credit hour. The average full-time tuition and fees for undergraduates are shown in the table below.
| In State | Out of State | |
|---|---|---|
| Tuition | $4,371 | $15,424 |
| Fees | $1,600 | $1,600 |
| Books and Supplies | $1,275 | $1,275 |
| On Campus Room and Board | $11,642 | $11,642 |
| On Campus Other Expenses | $4,752 | $4,752 |
Learn more about University of West Georgia tuition and fees.
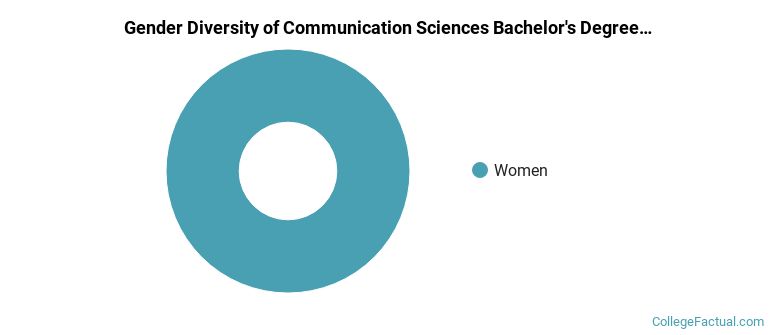
All of the 44 students who graduated with a Bachelor’s in communication sciences from University of West Georgia in 2022 were women.
The majority of bachelor's degree recipients in this major at University of West Georgia are white. In the most recent graduating class for which data is available, 68% of students fell into this category.
The following table and chart show the ethnic background for students who recently graduated from University of West Georgia with a bachelor's in communication sciences.
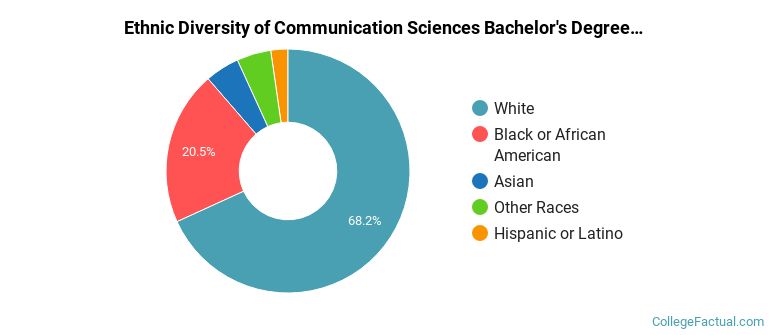
| Ethnic Background | Number of Students |
|---|---|
| Asian | 2 |
| Black or African American | 9 |
| Hispanic or Latino | 1 |
| White | 30 |
| Non-Resident Aliens | 0 |
| Other Races | 2 |
University of West Georgia does not offer an online option for its communication sciences bachelor’s degree program at this time. To see if the school offers distance learning options in other areas, visit the University of West Georgia Online Learning page.
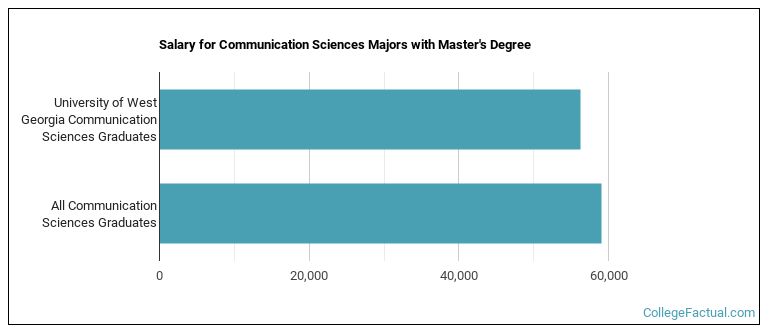
Graduates of the master's communication sciences program at University of West Georgia make a median salary of $56,238. This is less than what their typical peers from other schools make. Their median salary is $59,094.
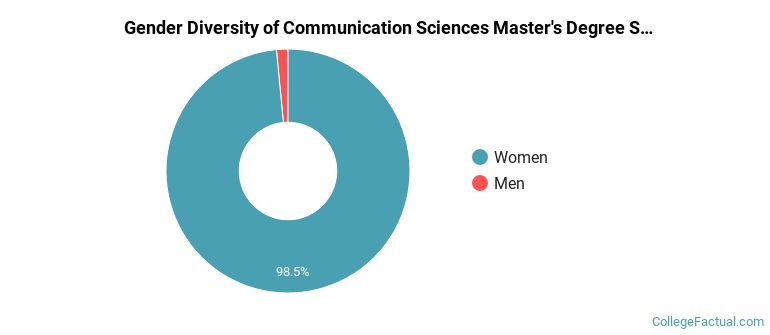
During the 2021-2022 academic year, 66 communication sciences majors earned their master's degree from University of West Georgia. Of these graduates, 2% were men and 98% were women.
The majority of the students with this major are white. About 85% of 2022 graduates were in this category.
The following table and chart show the ethnic background for students who recently graduated from University of West Georgia with a master's in communication sciences.
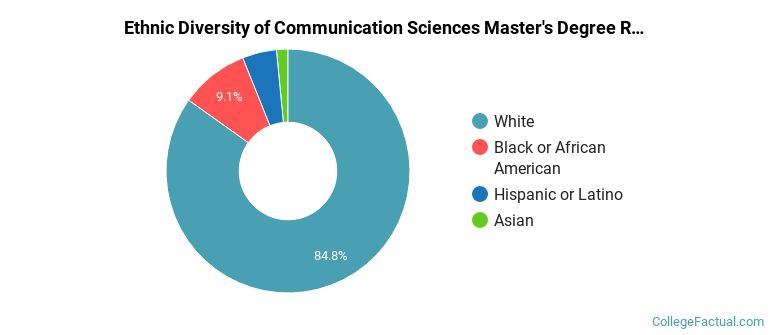
| Ethnic Background | Number of Students |
|---|---|
| Asian | 1 |
| Black or African American | 6 |
| Hispanic or Latino | 3 |
| White | 56 |
| Non-Resident Aliens | 0 |
| Other Races | 0 |
Take a look at the following statistics related to the make-up of the communication sciences majors at University of West Georgia.
| Related Major | Annual Graduates |
|---|---|
| Nursing | 190 |
| Health Sciences & Services | 75 |
| Bioethics/Medical Ethics | 1 |