We've pulled together some essential information you should know about the program, including how many students graduate each year, the ethnic diversity of these students, average starting salaries, and more. Also, learn how Villanova ranks among other schools offering degrees in political science.
Jump to any of the following sections:
Learn about start dates, transferring credits, availability of financial aid, and more by contacting the universities below.
Gain a solid understanding of American political history, the current political landscape, and the major political parties with this online bachelor's from Southern New Hampshire University.
Villanova is in the top 10% of the country for political science. More specifically it was ranked #34 out of 591 schools by College Factual. It is also ranked #2 in Pennsylvania.
During the 2021-2022 academic year, Villanova University handed out 106 bachelor's degrees in political science & government. This is a decrease of 14% over the previous year when 123 degrees were handed out.
In 2022, 10 students received their master’s degree in political science from Villanova. This makes it the #49 most popular school for political science master’s degree candidates in the country.
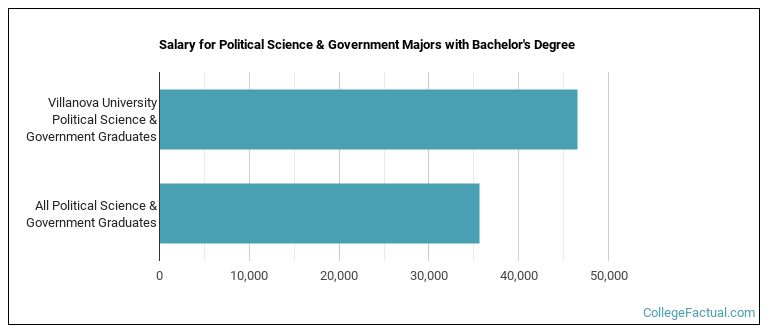
The median salary of political science students who receive their bachelor's degree at Villanova is $46,549. This is higher than $35,631, which is the national median for all political science bachelor's degree recipients.
The typical student loan payment of a bachelor's degree student from the political science program at Villanova is $538 per month.
During the 2022-2023 academic year, part-time undergraduate students at Villanova paid an average of $1,010 per credit hour. No discount was available for in-state students. Information about average full-time undergraduate tuition and fees is shown in the table below.
| In State | Out of State | |
|---|---|---|
| Tuition | $63,806 | $63,806 |
| Fees | $895 | $895 |
| Books and Supplies | $1,100 | $1,100 |
| On Campus Room and Board | $16,896 | $16,896 |
| On Campus Other Expenses | $2,300 | $2,300 |
Learn more about Villanova tuition and fees.
Of the 106 political science students who graduated with a bachelor's degree in 2021-2022 from Villanova, about 40% were men and 60% were women.

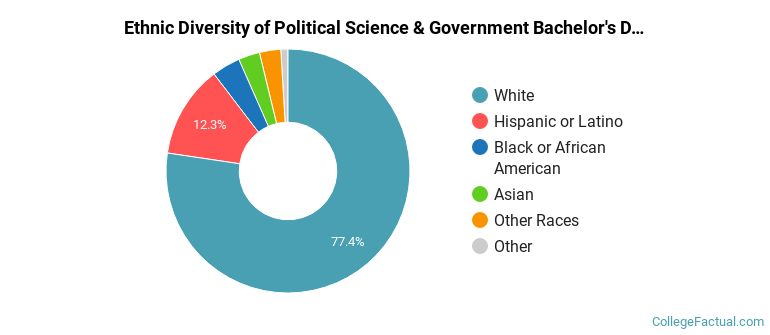
The majority of the students with this major are white. About 77% of 2022 graduates were in this category.
The following table and chart show the ethnic background for students who recently graduated from Villanova University with a bachelor's in political science.
| Ethnic Background | Number of Students |
|---|---|
| Asian | 3 |
| Black or African American | 4 |
| Hispanic or Latino | 13 |
| White | 82 |
| Non-Resident Aliens | 1 |
| Other Races | 3 |
Online degrees for the Villanova political science bachelor’s degree program are not available at this time. To see if the school offers distance learning options in other areas, visit the Villanova Online Learning page.
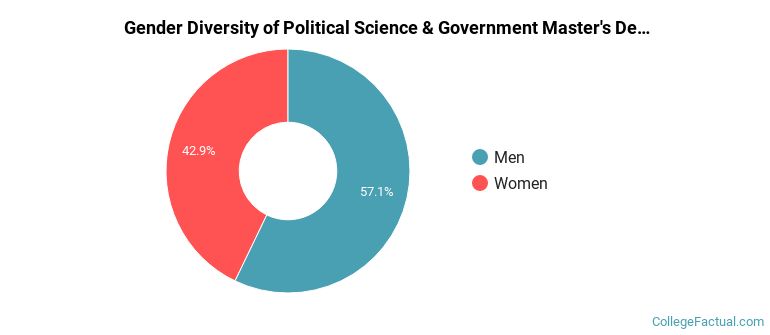
For the most recent academic year available, 57% of political science master's degrees went to men and 43% went to women.
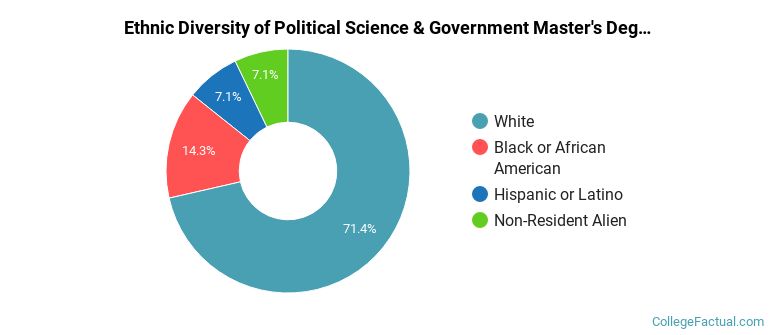
The majority of the students with this major are white. About 71% of 2022 graduates were in this category.
The following table and chart show the ethnic background for students who recently graduated from Villanova University with a master's in political science.
| Ethnic Background | Number of Students |
|---|---|
| Asian | 0 |
| Black or African American | 2 |
| Hispanic or Latino | 1 |
| White | 10 |
| Non-Resident Aliens | 1 |
| Other Races | 0 |
Take a look at the following statistics related to the make-up of the political science majors at Villanova University.
| Related Major | Annual Graduates |
|---|---|
| Economics | 124 |
| Geography & Cartography | 16 |
| Sociology | 16 |
| International Relations & National Security | 5 |
View All Political Science & Government Related Majors >
More about our data sources and methodologies.
