Williamson College of the Trades total enrollment is approximately 249 students.
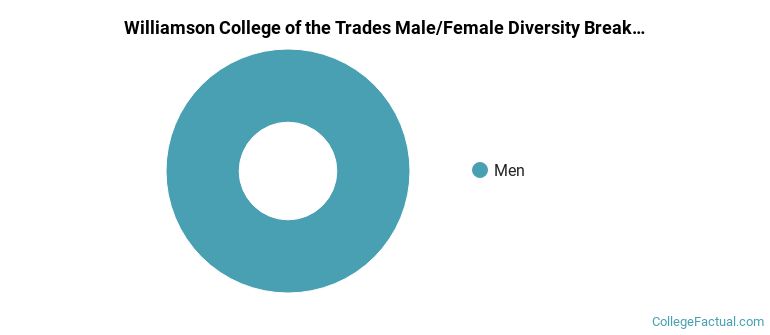
For the gender breakdown for all students, go here.
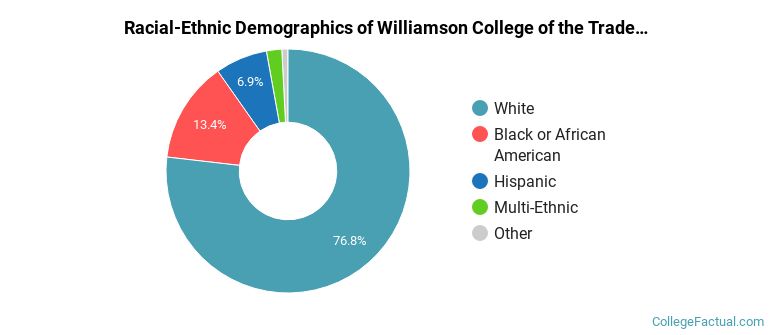
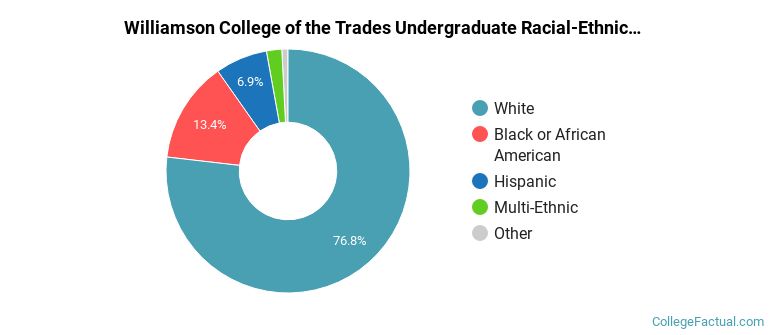
Williamson College of the Trades Racial/Ethnic Breakdown of Undergraduates
| Race/Ethnicity | Number |
|---|---|
| White | 203 |
| Black or African American | 24 |
| Hispanic | 15 |
| Multi-Ethnic | 6 |
| Asian | 1 |
| Native Hawaiian or Pacific Islander | 0 |
| International | 0 |
| Unknown | 0 |
See racial/ethnic breakdown for all students.
| Race/Ethnicity | Number |
|---|---|
| White | 203 |
| Black or African American | 24 |
| Hispanic | 15 |
| Multi-Ethnic | 6 |
| Asian | 1 |
| Native Hawaiian or Pacific Islander | 0 |
| International | 0 |
| Unknown | 0 |
Footnotes
*The racial-ethnic minorities count is calculated by taking the total number of students and subtracting white students, international students, and students whose race/ethnicity was unknown. This number is then divided by the total number of students at the school to obtain the racial-ethnic minorities percentage.
References