Each year, College Factual releases its Best Quality Schools ranking to identify graduate schools that offer a great educational experience and provide excellent student outcomes. Factors that go into these rankings include how much money students make after graduation, the number of FTE students per instructor, and how much debt students take on to attend the school.
Out of the 1149 colleges and universities analyzed in College Factual's 2024 Best Master's Degree Schools in the U.S. ranking, Eastern Illinois University took the #589 spot.
EIU also ranked #27 for Best Master's Degree Schools in Illinois.
Athough the male-female ratio may vary depending on the degree program, 68.0% of the total graduate students at EIU are women and 32.0% are men.

Racial-ethnic minorities* make up 13.8% of the graduate student population at EIU. Americans aren't the only ones who appreciate the graduate programs at EIU. Around 9.2% of graduate students are international. The chart below shows the breakdown of graduate student demographics at the school. You can click on it for a more detailed view.

The average tuition and fees for graduate students is shown below.
| In-State | Out-of-State | |
|---|---|---|
| Tuition | $7,691 | $18,458 |
| Fees | $2,949 | $2,949 |
The average starting salary for graduate students who earn their master's degree at EIU is $44,982. When comparing to other master's degree holders, that's on the low side. It's about 23% lower than the national average of $58,425.

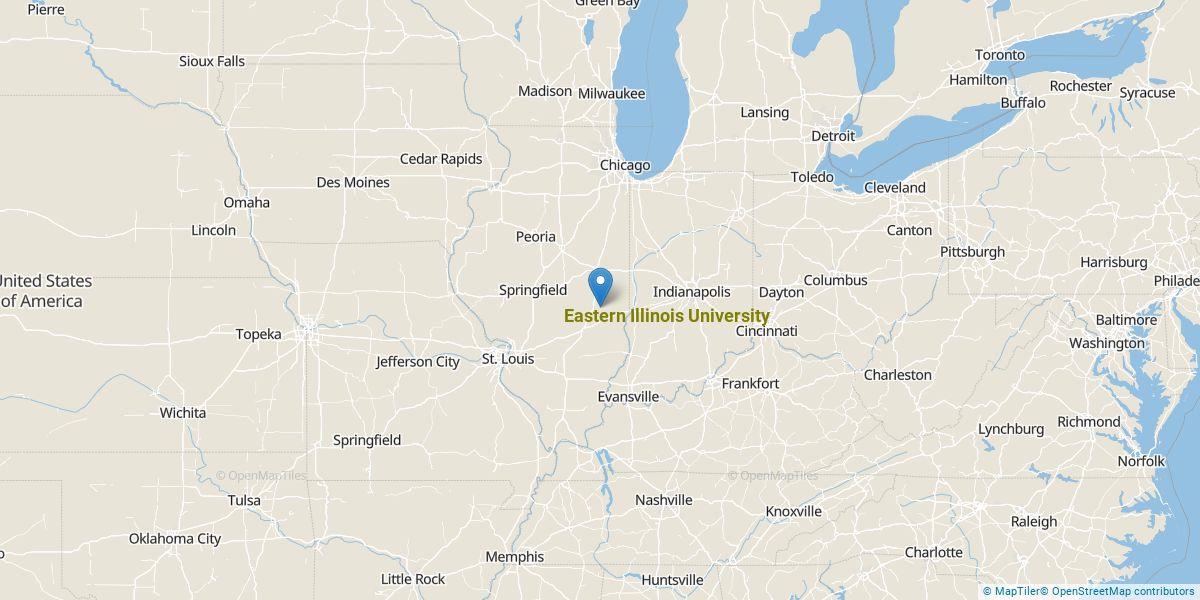
Get more details about the location of Eastern Illinois University.
Contact details for EIU are given below.
| Contact Details | |
|---|---|
| Address: | 600 Lincoln Avenue, Charleston, IL 61920 |
| Phone: | 217-581-5000 |
| Website: | https://www.eiu.edu/ |
| Facebook: | http://www.facebook.com/iameiu |
| Twitter: | http://www.twitter.com/eiu |
During the 2020-2021 academic year, 69.6% of the graduate students at EIU took at least one online course. Roughly 43.2% of all grad students took courses exclusively online.

The only degree programs listed here are those in which master’s degrees were awarded in 2020-2021.
Footnotes
*The racial-ethnic minorities count is calculated by taking the total number of students and subtracting white students, international students, and students whose race/ethnicity was unknown. This number is then divided by the total number of students at the school to obtain the racial-ethnic minorities percentage.
References
More about our data sources and methodologies.