Public Administration & Social Service is a program of study at George Mason University. The school offers a doctor’s degree in the area. Here, you’ll find out more about the major doctor’s degree program in public administration and social service, including such details as the number of graduates, ethnicity of students, related majors and concentrations, and more.
If there’s something special you’re looking for, you can use one of the links below to find it:
Learn about start dates, transferring credits, availability of financial aid, and more by contacting the universities below.
Fit new strategic skills into your public service passion and goals when you earn an MBA in Public Administration from Southern New Hampshire University.
Improve the lives of individuals, families and communities with the human service tools gained from this online bachelor's from Southern New Hampshire University.
BS in Business Administration - Public Administration
Prepare yourself to make the decisions that best serve a community, its constituents and its economic growth with this specialized business degree from Southern New Hampshire University.
In 2019-2020, the average part-time graduate tuition at GMU was $1,559 per credit hour for out-of-state students. The average for in-state students was $671 per credit hour. The average full-time tuition and fees for graduate students are shown in the table below.
| In State | Out of State | |
|---|---|---|
| Tuition | $12,594 | $33,906 |
| Fees | $3,504 | $3,504 |
Online degrees for the GMU public administration and social service doctor’s degree program are not available at this time. To see if the school offers distance learning options in other areas, visit the GMU Online Learning page.
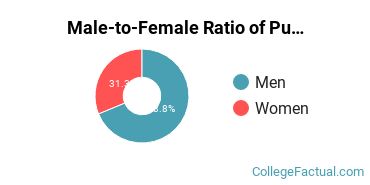
Women made up around 31.3% of the public administration and social service students who took home a doctor’s degree in 2019-2020. This is less than the nationwide number of 70.1%.
Of those graduates who received a doctor’s degree in public administration and social service at GMU in 2019-2020, 37.5% were racial-ethnic minorities*. This is about the same as the nationwide number of 38%.
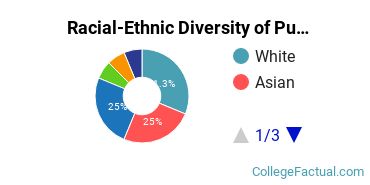
| Race/Ethnicity | Number of Students |
|---|---|
| Asian | 4 |
| Black or African American | 1 |
| Hispanic or Latino | 1 |
| Native American or Alaska Native | 0 |
| Native Hawaiian or Pacific Islander | 0 |
| White | 5 |
| International Students | 4 |
| Other Races/Ethnicities | 1 |
Public Administration & Social Service students may decide to major in one of the following focus areas.
| Focus Area | Annual Graduates |
|---|---|
| Public Policy | 16 |
*The racial-ethnic minorities count is calculated by taking the total number of students and subtracting white students, international students, and students whose race/ethnicity was unknown. This number is then divided by the total number of students at the school to obtain the racial-ethnic minorities percentage.
More about our data sources and methodologies.
