Fishing & Fisheries Sciences & Management is a concentration offered under the fisheries sciences major at Virginia Tech. Here, you’ll find out more about the major master’s degree program in fishing and fisheries sciences and management, including such details as the number of graduates, diversity of students, and more.
If there’s something special you’re looking for, you can use one of the links below to find it:
Learn about start dates, transferring credits, availability of financial aid, and more by contacting the universities below.
BS in Environmental Science - Natural Resources & Conservation
Develop a broad-based interdisciplinary skill set to solve complex environmental problems like climate change, alternative energy and sustainability with a specialized online degree from Southern New Hampshire University.
During the 2019-2020 academic year, part-time graduate students at Virginia Tech paid an average of $1,534 per credit hour if they came to the school from out-of-state. In-state students paid a discounted rate of $761 per credit hour. Information about average full-time graduate student tuition and fees is shown in the table below.
| In State | Out of State | |
|---|---|---|
| Tuition | $13,701 | $27,614 |
| Fees | $2,329 | $2,933 |
Virginia Tech does not offer an online option for its fishing and fisheries sciences and management master’s degree program at this time. To see if the school offers distance learning options in other areas, visit the Virginia Tech Online Learning page.
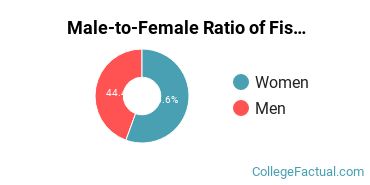
Of the students who received their master’s degree in fishing and fisheries sciences and management in 2019-2020, 55.6% of them were women. This is less than the nationwide number of 69.8%.
Of those graduates who received a master’s degree in fishing and fisheries sciences and management at Virginia Tech in 2019-2020, 11.1% were racial-ethnic minorities*. This is about the same as the nationwide number of 9%.
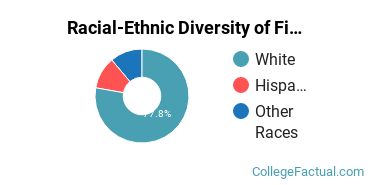
| Race/Ethnicity | Number of Students |
|---|---|
| Asian | 0 |
| Black or African American | 0 |
| Hispanic or Latino | 1 |
| Native American or Alaska Native | 0 |
| Native Hawaiian or Pacific Islander | 0 |
| White | 7 |
| International Students | 0 |
| Other Races/Ethnicities | 1 |
*The racial-ethnic minorities count is calculated by taking the total number of students and subtracting white students, international students, and students whose race/ethnicity was unknown. This number is then divided by the total number of students at the school to obtain the racial-ethnic minorities percentage.
More about our data sources and methodologies.
