Here, you'll find out more about the major, including such details as the number of graduates, what degree levels are offered, ethnicity of students, average salaries, and more. Also, learn how Concordia University, Chicago ranks among other schools offering degrees in phys ed.
Jump to any of the following sections:
Concordia University, Chicago is in the top 10% of the country for phys ed. More specifically it was ranked #39 out of 553 schools by College Factual. It is also ranked #2 in Illinois.
During the 2021-2022 academic year, Concordia University, Chicago handed out 93 bachelor's degrees in health & physical education. This is an increase of 1% over the previous year when 92 degrees were handed out.
In 2022, 300 students received their master’s degree in phys ed from Concordia University, Chicago. This makes it the #2 most popular school for phys ed master’s degree candidates in the country.
In addition, 32 students received their doctoral degrees in phys ed in 2022, making the school the #1 most popular school in the United States for this category of students.
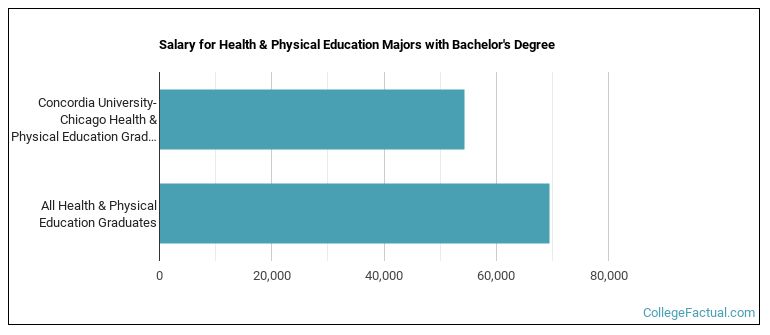
Phys Ed majors who earn their bachelor's degree from Concordia University, Chicago go on to jobs where they make a median salary of $29,231 a year. This is less than $30,571, which is the national median of all phys ed majors in the nation who earn bachelor's degrees.
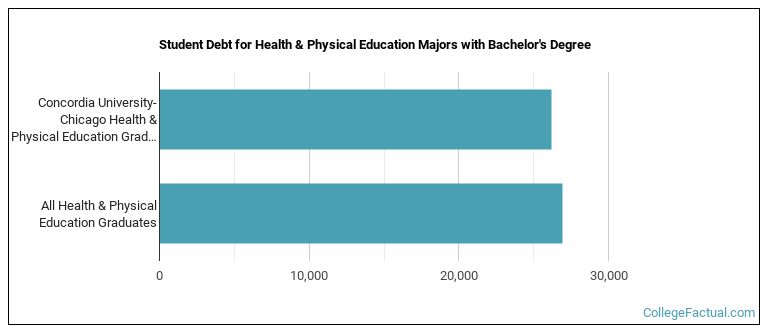
While getting their bachelor's degree at Concordia University, Chicago, phys ed students borrow a median amount of $33,674 in student loans. This is higher than the the typical median of $28,017 for all phys ed majors across the country.
In 2022-2023, the average part-time undergraduate tuition at Concordia University, Chicago was $1,068 per credit hour for both in-state and out-of-state students. The following table shows the average full-time tuition and fees for undergraduates.
| In State | Out of State | |
|---|---|---|
| Tuition | $35,200 | $35,200 |
| Fees | $1,058 | $1,058 |
| Books and Supplies | $1,200 | $1,200 |
| On Campus Room and Board | $11,140 | $11,140 |
| On Campus Other Expenses | $1,400 | $1,400 |
Learn more about Concordia University, Chicago tuition and fees.
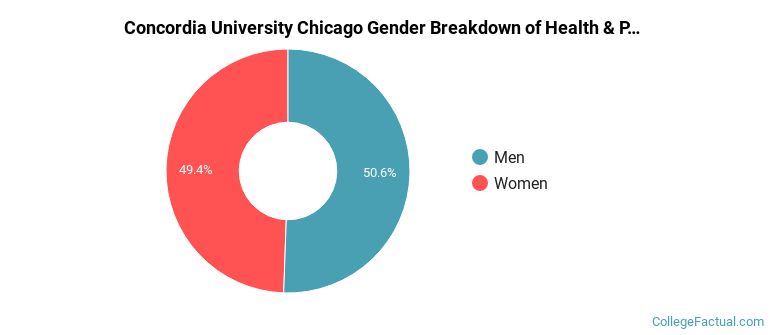
Of the 93 students who graduated with a Bachelor’s in phys ed from Concordia University, Chicago in 2022, 46% were men and 54% were women.
The majority of the students with this major are white. About 65% of 2022 graduates were in this category.
The following table and chart show the ethnic background for students who recently graduated from Concordia University, Chicago with a bachelor's in phys ed.
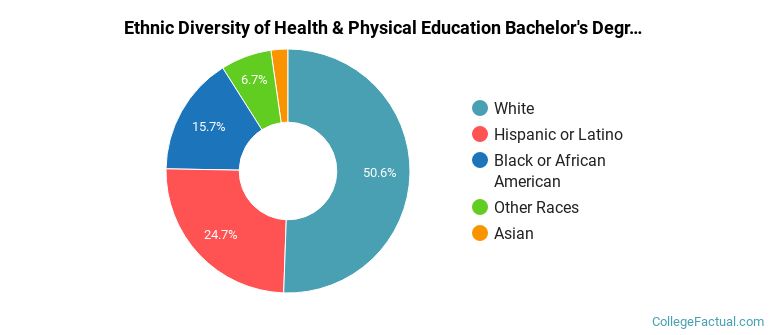
| Ethnic Background | Number of Students |
|---|---|
| Asian | 4 |
| Black or African American | 9 |
| Hispanic or Latino | 18 |
| White | 60 |
| Non-Resident Aliens | 0 |
| Other Races | 2 |
Online degrees for the Concordia University, Chicago phys ed bachelor’s degree program are not available at this time. To see if the school offers distance learning options in other areas, visit the Concordia University, Chicago Online Learning page.
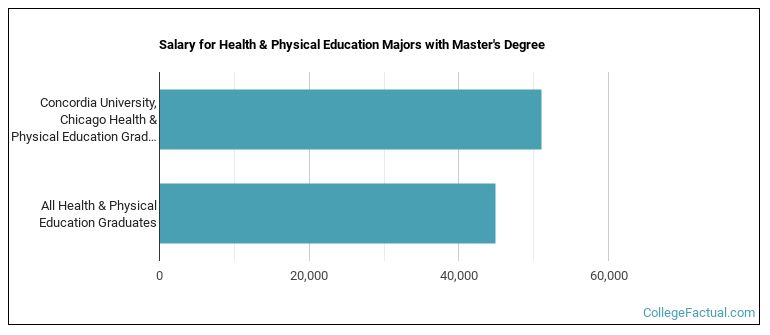
Phys Ed majors graduating with a master's degree from Concordia University, Chicago make a median salary of $51,084 a year. This is a better than average outcome since the median salary for all phys ed graduates with a master's is $44,941.
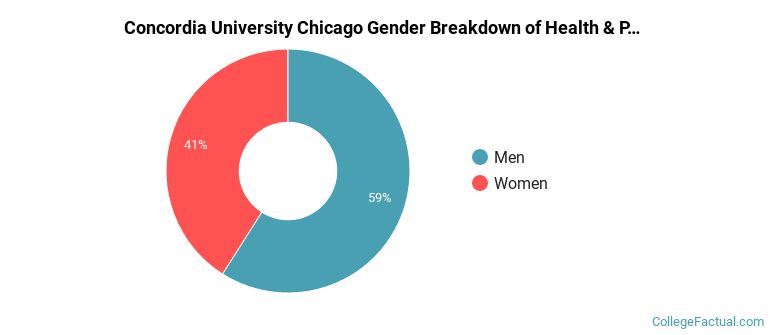
For the most recent academic year available, 59% of phys ed master's degrees went to men and 41% went to women.
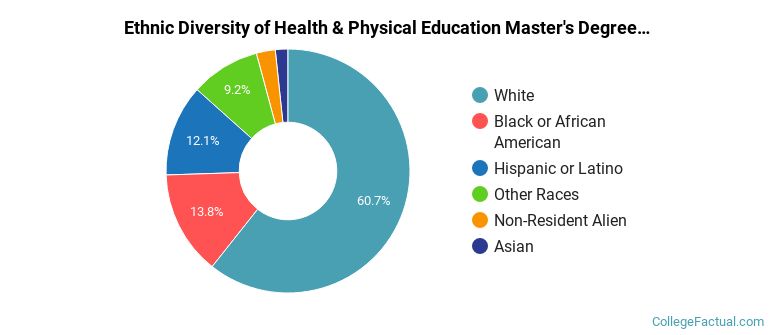
The majority of master's degree recipients in this major at Concordia University, Chicago are white. In the most recent graduating class for which data is available, 61% of students fell into this category.
The following table and chart show the ethnic background for students who recently graduated from Concordia University, Chicago with a master's in phys ed.
| Ethnic Background | Number of Students |
|---|---|
| Asian | 13 |
| Black or African American | 25 |
| Hispanic or Latino | 34 |
| White | 152 |
| Non-Resident Aliens | 0 |
| Other Races | 26 |
Take a look at the following statistics related to the make-up of the phys ed majors at Concordia University, Chicago.
More about our data sources and methodologies.