We've pulled together some essential information you should know about the program, including how many students graduate each year, the ethnic diversity of these students, average starting salaries, and more. We've also included details on how Cornell ranks compared to other colleges offering a major in ee.
Go directly to any of the following sections:
In College Factual's most recent rankings for the best schools for ee majors, Cornell came in at #7. This puts it in the top 5% of the country in this field of study. It is also ranked #1 in New York.
During the 2021-2022 academic year, Cornell University handed out 87 bachelor's degrees in electrical engineering. This is a decrease of 7% over the previous year when 94 degrees were handed out.
In 2022, 148 students received their master’s degree in ee from Cornell. This makes it the #17 most popular school for ee master’s degree candidates in the country.
In addition, 22 students received their doctoral degrees in ee in 2022, making the school the #31 most popular school in the United States for this category of students.
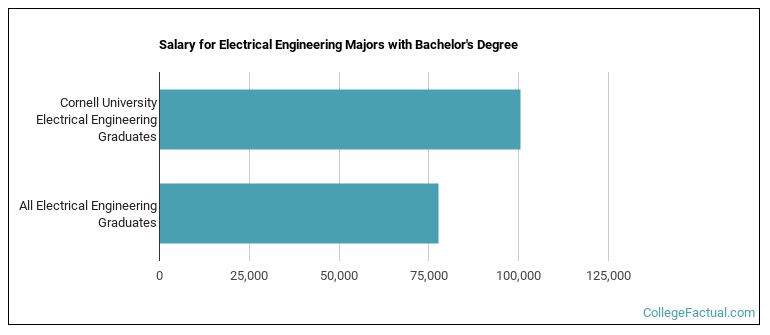
The median salary of ee students who receive their bachelor's degree at Cornell is $100,516. This is higher than $77,687, which is the national median for all ee bachelor's degree recipients.
In 2022-2023, the average part-time undergraduate tuition at Cornell was $1,750 per credit hour for both in-state and out-of-state students. The average full-time tuition and fees for undergraduates are shown in the table below.
| In State | Out of State | |
|---|---|---|
| Tuition | $65,204 | $65,204 |
| Fees | $810 | $810 |
| Books and Supplies | $1,354 | $1,354 |
| On Campus Room and Board | $18,554 | $18,554 |
| On Campus Other Expenses | $2,218 | $2,218 |
Learn more about Cornell tuition and fees.
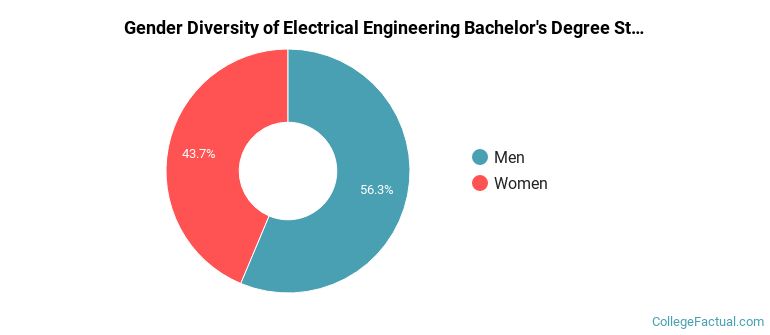
Of the 87 students who graduated with a Bachelor’s in ee from Cornell in 2022, 56% were men and 44% were women.
The following table and chart show the ethnic background for students who recently graduated from Cornell University with a bachelor's in ee.
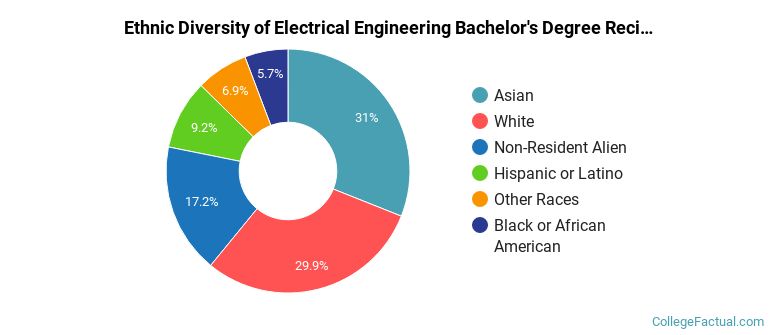
| Ethnic Background | Number of Students |
|---|---|
| Asian | 27 |
| Black or African American | 5 |
| Hispanic or Latino | 8 |
| White | 26 |
| Non-Resident Aliens | 15 |
| Other Races | 6 |
Cornell does not offer an online option for its ee bachelor’s degree program at this time. To see if the school offers distance learning options in other areas, visit the Cornell Online Learning page.
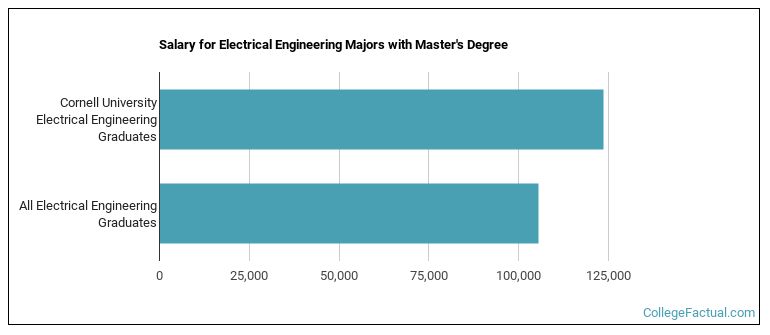
EE majors graduating with a master's degree from Cornell make a median salary of $123,494 a year. This is a better than average outcome since the median salary for all ee graduates with a master's is $105,380.
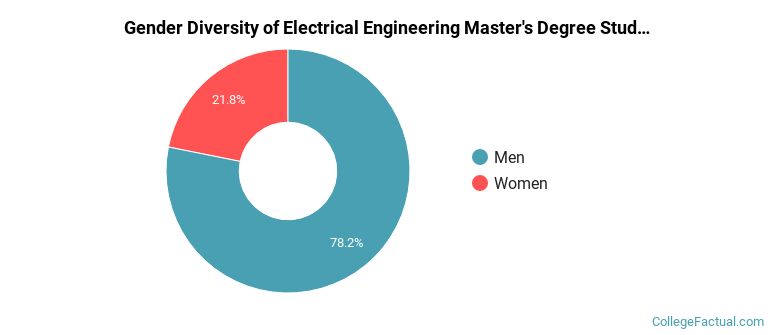
Of the 119 ee students who graduated with a master's degree in 2021-2022 from Cornell, about 78% were men and 22% were women.
The following table and chart show the ethnic background for students who recently graduated from Cornell University with a master's in ee.
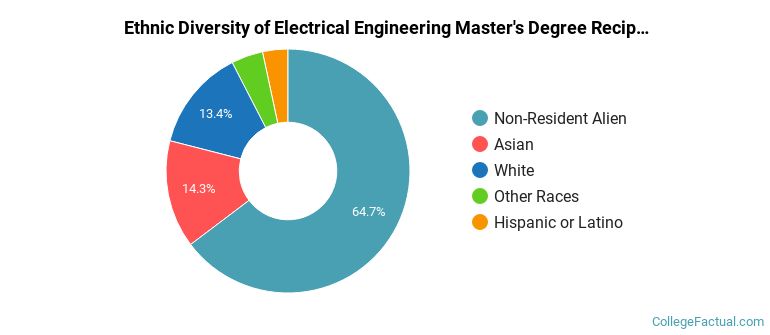
| Ethnic Background | Number of Students |
|---|---|
| Asian | 17 |
| Black or African American | 0 |
| Hispanic or Latino | 4 |
| White | 16 |
| Non-Resident Aliens | 77 |
| Other Races | 5 |
Take a look at the following statistics related to the make-up of the ee majors at Cornell University.
| Related Major | Annual Graduates |
|---|---|
| Mechanical Engineering | 241 |
| Operations Research | 228 |
| Biomedical Engineering | 138 |
| Systems Engineering | 121 |
| Chemical Engineering | 120 |
More about our data sources and methodologies.