Here, you'll find out more about the major, including such details as the number of graduates, what degree levels are offered, ethnicity of students, average salaries, and more. Also, learn how Foothill College ranks among other schools offering degrees in dental support.
Go directly to any of the following sections:
In College Factual's most recent rankings for the best schools for dental support majors, Foothill College came in at #10. This puts it in the top 5% of the country in this field of study. It is also ranked #5 in California.
| Ranking Type | Rank |
|---|---|
| Best Dental Support Services Bachelor’s Degree Schools | 8 |
| Best Dental Support Services Schools | 10 |
During the 2021-2022 academic year, Foothill College handed out 76 bachelor's degrees in dental support services. This is an increase of 6% over the previous year when 72 degrees were handed out.
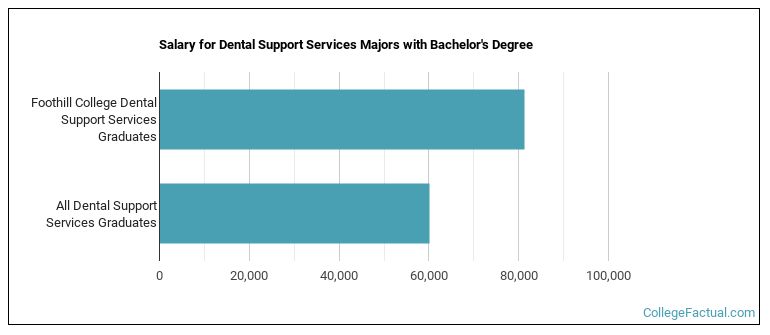
The median salary of dental support students who receive their bachelor's degree at Foothill College is $81,255. This is higher than $60,171, which is the national median for all dental support bachelor's degree recipients.
In 2022-2023, the average part-time undergraduate tuition at Foothill College was $270 per credit hour for out-of-state students. The average for in-state students was $31 per credit hour. The average full-time tuition and fees for undergraduates are shown in the table below.
| In State | Out of State | |
|---|---|---|
| Tuition | $1,395 | $12,150 |
| Fees | $170 | $170 |
| Books and Supplies | $1,794 | $1,794 |
Learn more about Foothill College tuition and fees.
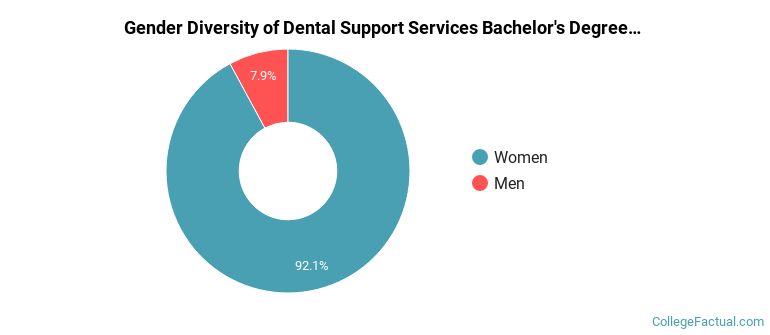
Of the 76 dental support students who graduated with a bachelor's degree in 2021-2022 from Foothill College, about 8% were men and 92% were women.
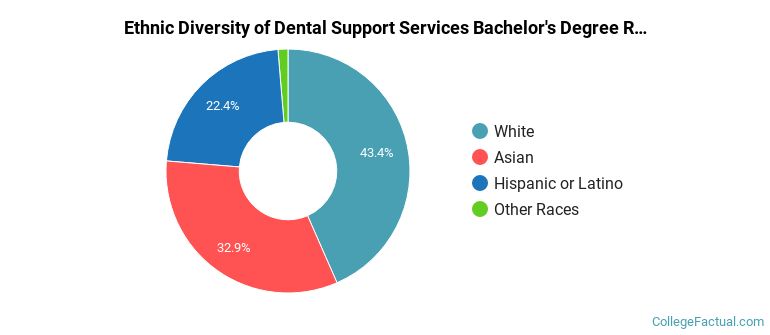
The following table and chart show the ethnic background for students who recently graduated from Foothill College with a bachelor's in dental support.
| Ethnic Background | Number of Students |
|---|---|
| Asian | 25 |
| Black or African American | 0 |
| Hispanic or Latino | 17 |
| White | 33 |
| Non-Resident Aliens | 0 |
| Other Races | 1 |
Online degrees for the Foothill College dental support bachelor’s degree program are not available at this time. To see if the school offers distance learning options in other areas, visit the Foothill College Online Learning page.
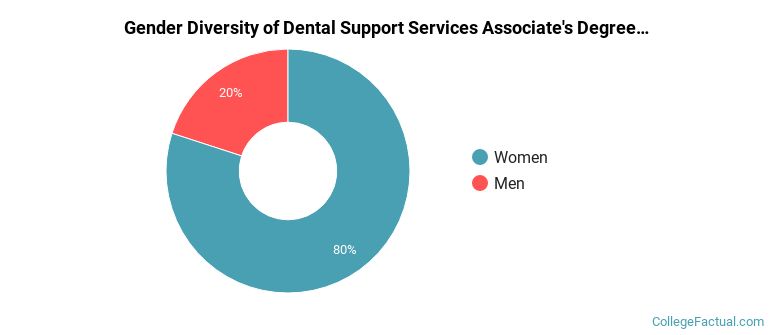
Of the 10 dental support students who graduated with a associate's degree in 2021-2022 from Foothill College, about 20% were men and 80% were women.
The majority of associate's degree recipients in this major at Foothill College are Asian American. In the most recent graduating class for for which data is available, 90% of students fell into this category.
The following table and chart show the ethnic background for students who recently graduated from Foothill College with a associate's in dental support.
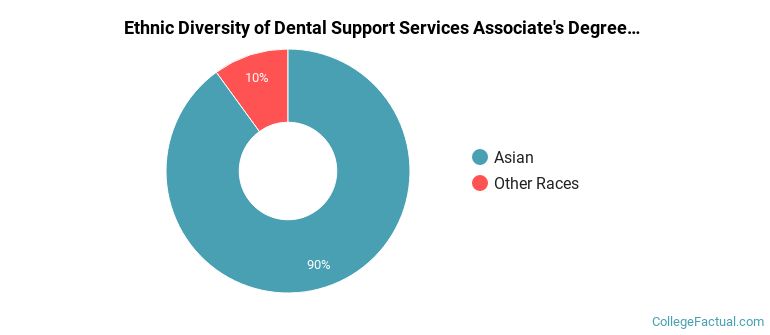
| Ethnic Background | Number of Students |
|---|---|
| Asian | 9 |
| Black or African American | 0 |
| Hispanic or Latino | 0 |
| White | 0 |
| Non-Resident Aliens | 0 |
| Other Races | 1 |
Take a look at the following statistics related to the make-up of the dental support majors at Foothill College.
| Related Major | Annual Graduates |
|---|---|
| Allied Health Professions | 72 |
| Health Sciences & Services | 53 |
| Allied Health & Medical Assisting Services | 29 |