We've pulled together some essential information you should know about the program, including how many students graduate each year, the ethnic diversity of these students, average starting salaries, and more. Also, learn how Fort Valley State University ranks among other schools offering degrees in consumer science.
Jump to any of the following sections:
The consumer science major at Fort Valley State University is not ranked on College Factual’s Best Colleges and Universities for General Family & Consumer Sciences. This could be for a number of reasons, such as not having enough data on the major or school to make an accurate assessment of its quality.
During the 2021-2022 academic year, Fort Valley State University handed out 8 bachelor's degrees in general family & consumer sciences. This is a decrease of 38% over the previous year when 13 degrees were handed out.
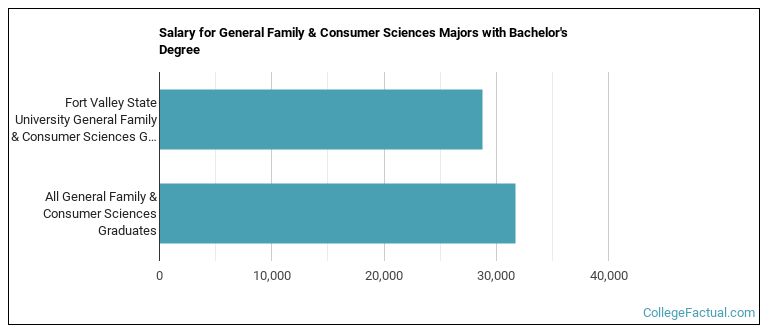
Consumer Science majors who earn their bachelor's degree from Fort Valley State University go on to jobs where they make a median salary of $28,794 a year. Unfortunately, this is lower than the national average of $31,748 for all consumer science students.
While getting their bachelor's degree at Fort Valley State University, consumer science students borrow a median amount of $23,606 in student loans. This is higher than the the typical median of $19,338 for all consumer science majors across the country.

The typical student loan payment of a bachelor's degree student from the consumer science program at Fort Valley State University is $259 per month.
In 2022-2023, the average part-time undergraduate tuition at Fort Valley State University was $616 per credit hour for out-of-state students. The average for in-state students was $169 per credit hour. The average full-time tuition and fees for undergraduates are shown in the table below.
| In State | Out of State | |
|---|---|---|
| Tuition | $4,064 | $14,786 |
| Fees | $1,328 | $1,328 |
| Books and Supplies | $1,500 | $1,500 |
| On Campus Room and Board | $8,372 | $8,372 |
| On Campus Other Expenses | $5,000 | $5,000 |
Learn more about Fort Valley State University tuition and fees.
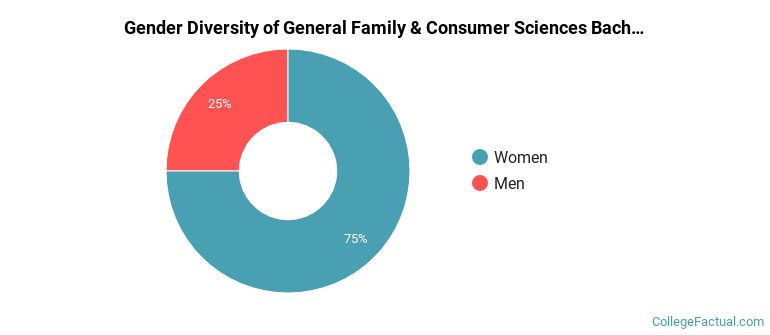
During the 2021-2022 academic year, 8 consumer science majors earned their bachelor's degree from Fort Valley State University. Of these graduates, 25% were men and 75% were women.
The majority of the bachelor's degree graduates for this major are black or African Americans. About 100% of grads fell into this category.
The following table and chart show the ethnic background for students who recently graduated from Fort Valley State University with a bachelor's in consumer science.

| Ethnic Background | Number of Students |
|---|---|
| Asian | 0 |
| Black or African American | 8 |
| Hispanic or Latino | 0 |
| White | 0 |
| Non-Resident Aliens | 0 |
| Other Races | 0 |
Fort Valley State University does not offer an online option for its consumer science bachelor’s degree program at this time. To see if the school offers distance learning options in other areas, visit the Fort Valley State University Online Learning page.
Take a look at the following statistics related to the make-up of the consumer science majors at Fort Valley State University.
More about our data sources and methodologies.