Here, you'll find out more about the major, including such details as the number of graduates, what degree levels are offered, ethnicity of students, average salaries, and more. Also, learn how Full Sail University ranks among other schools offering degrees in film.
Go directly to any of the following sections:
Learn about start dates, transferring credits, availability of financial aid, and more by contacting the universities below.
Take the first step toward a career of visual expression and doing what you love with this online associate degree from Southern New Hampshire University.
Learn to create a striking portfolio and hone the skills you need to succeed in the world of professional photography with this online digital photography degree from Southern New Hampshire University.
The bachelor's program at Full Sail University was ranked #210 on College Factual's Best Schools for film list. It is also ranked #10 in Florida.
During the 2021-2022 academic year, Full Sail University handed out 505 bachelor's degrees in film, video & photographic arts. This is an increase of 26% over the previous year when 401 degrees were handed out.
In 2022, 79 students received their master’s degree in film from Full Sail University. This makes it the #5 most popular school for film master’s degree candidates in the country.
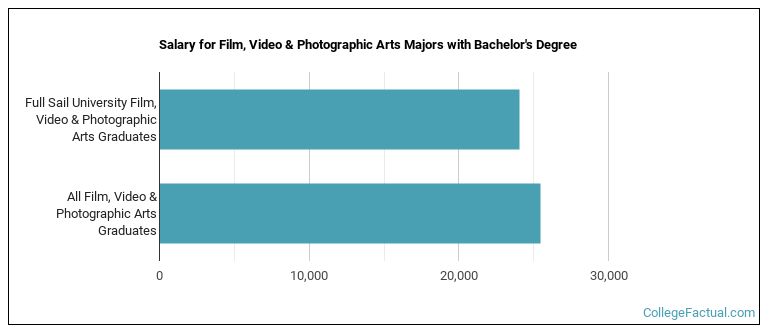
Film majors who earn their bachelor's degree from Full Sail University go on to jobs where they make a median salary of $24,078 a year. This is less than $25,425, which is the national median of all film majors in the nation who earn bachelor's degrees.
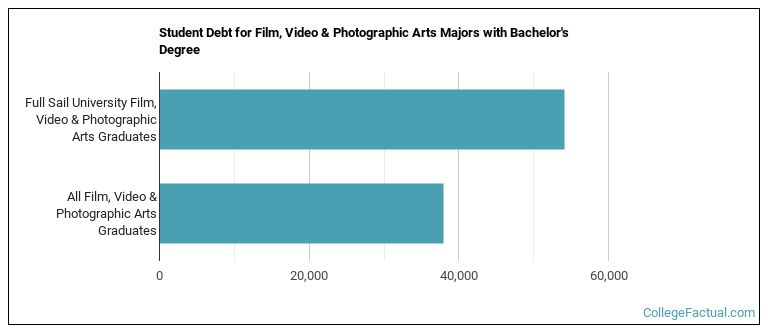
While getting their bachelor's degree at Full Sail University, film students borrow a median amount of $54,111 in student loans. This is higher than the the typical median of $37,900 for all film majors across the country.
The typical student loan payment of a bachelor's degree student from the film program at Full Sail University is $681 per month.
The average full-time tuition and fees for undergraduates are shown in the table below.
| In State | Out of State | |
|---|---|---|
| Tuition | $26,417 | $26,417 |
| Books and Supplies | $530 | $530 |
Learn more about Full Sail University tuition and fees.
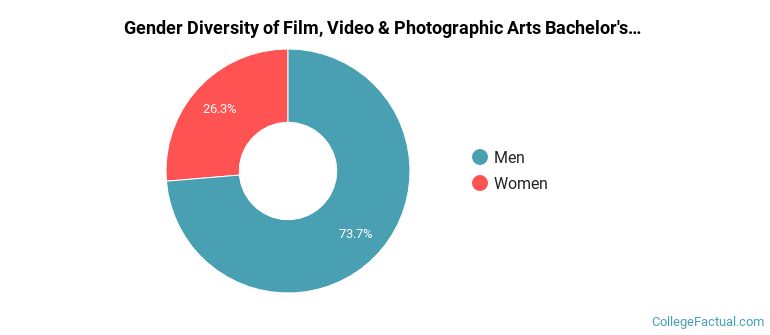
During the 2021-2022 academic year, 505 students graduated with a bachelor's degree in film from Full Sail University. About 74% were men and 26% were women.
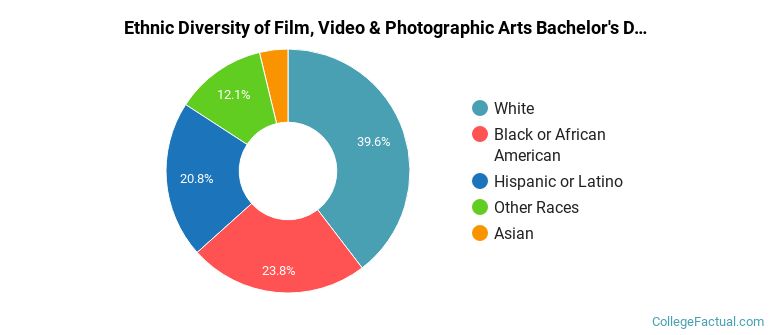
The following table and chart show the ethnic background for students who recently graduated from Full Sail University with a bachelor's in film.
| Ethnic Background | Number of Students |
|---|---|
| Asian | 19 |
| Black or African American | 120 |
| Hispanic or Latino | 105 |
| White | 200 |
| Non-Resident Aliens | 0 |
| Other Races | 61 |
Full Sail University does not offer an online option for its film bachelor’s degree program at this time. To see if the school offers distance learning options in other areas, visit the Full Sail University Online Learning page.
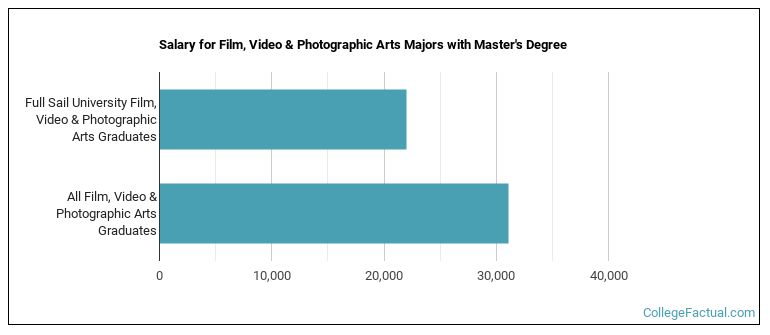
Graduates of the master's film program at Full Sail University make a median salary of $21,973. This is less than what their typical peers from other schools make. Their median salary is $31,087.
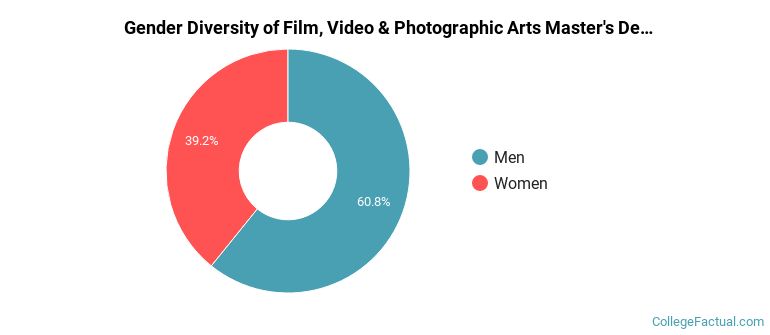
Of the 74 students who earned a master's degree in Film, Video & Photographic Arts from Full Sail University in 2021-2022, 61% were men and 39% were women.
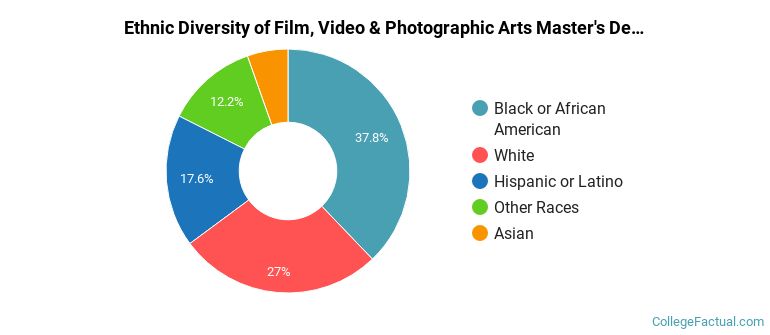
The following table and chart show the ethnic background for students who recently graduated from Full Sail University with a master's in film.
| Ethnic Background | Number of Students |
|---|---|
| Asian | 4 |
| Black or African American | 28 |
| Hispanic or Latino | 13 |
| White | 20 |
| Non-Resident Aliens | 0 |
| Other Races | 9 |
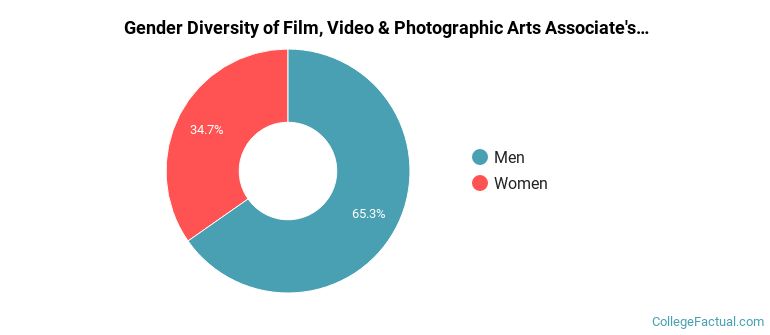
Of the 72 students who earned an associate's degree in Film, Video & Photographic Arts from Full Sail University in 2021-2022, 65% were men and 35% were women.
The following table and chart show the ethnic background for students who recently graduated from Full Sail University with a associate's in film.
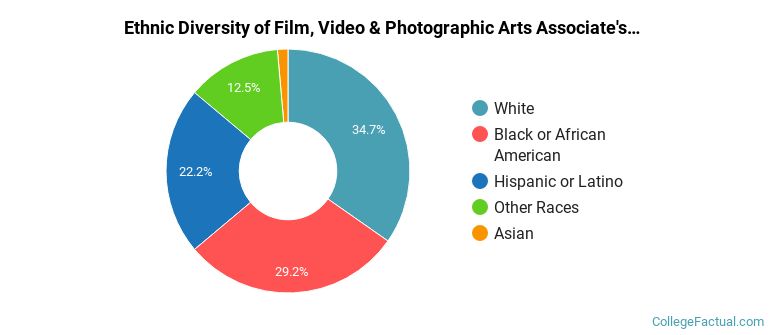
| Ethnic Background | Number of Students |
|---|---|
| Asian | 1 |
| Black or African American | 21 |
| Hispanic or Latino | 16 |
| White | 25 |
| Non-Resident Aliens | 0 |
| Other Races | 9 |
Take a look at the following statistics related to the make-up of the film majors at Full Sail University.
| Related Major | Annual Graduates |
|---|---|
| Design & Applied Arts | 564 |
| General Visual & Performing Arts | 453 |
| Arts & Media Management | 415 |
| Music | 258 |
| Fine & Studio Arts | 252 |
