Here, you'll find out more about the major, including such details as the number of graduates, what degree levels are offered, ethnicity of students, average salaries, and more. In addition, we cover how Harvard ranks in comparison to other schools with political science programs.
Jump to any of the following sections:
Learn about start dates, transferring credits, availability of financial aid, and more by contacting the universities below.
Gain a solid understanding of American political history, the current political landscape, and the major political parties with this online bachelor's from Southern New Hampshire University.
Ranked at #6 in College Factual's most recent rankings, Harvard is in the top 1% of the country for political science students pursuing a bachelor's degree. It is also ranked #1 in Massachusetts.
During the 2021-2022 academic year, Harvard University handed out 121 bachelor's degrees in political science & government. This is an increase of 55% over the previous year when 78 degrees were handed out.
In 2022, 58 students received their master’s degree in political science from Harvard. This makes it the #3 most popular school for political science master’s degree candidates in the country.
In addition, 21 students received their doctoral degrees in political science in 2022, making the school the #1 most popular school in the United States for this category of students.
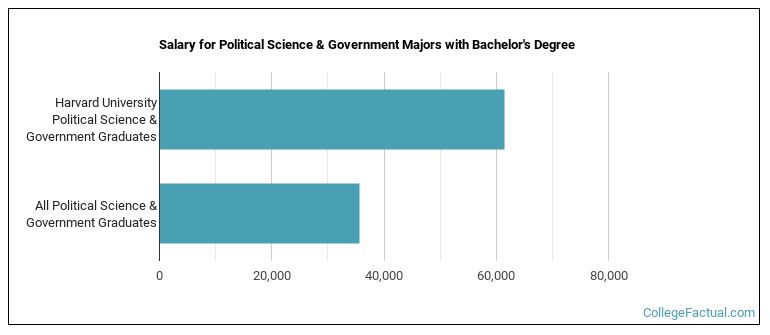
The median salary of political science students who receive their bachelor's degree at Harvard is $61,543. This is higher than $35,631, which is the national median for all political science bachelor's degree recipients.
During the 2022-2023 academic year, part-time undergraduate students at Harvard paid an average of $1,696 per credit hour. No discount was available for in-state students. The following table shows the average full-time tuition and fees for undergraduates.
| In State | Out of State | |
|---|---|---|
| Tuition | $54,269 | $54,269 |
| Fees | $4,807 | $4,807 |
| Books and Supplies | $1,000 | $1,000 |
| On Campus Room and Board | $20,374 | $20,374 |
| On Campus Other Expenses | $6,255 | $6,255 |
Learn more about Harvard tuition and fees.
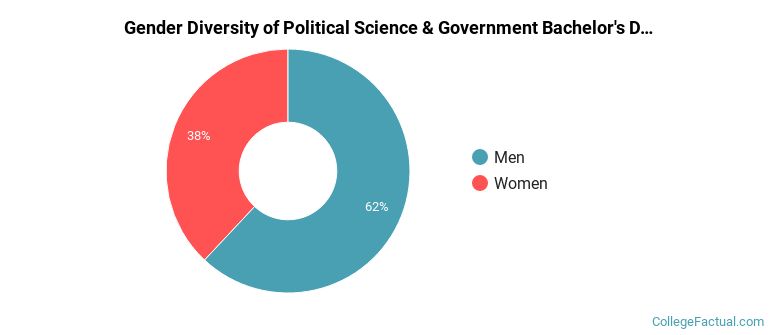
In the 2021-2022 academic year, 121 students earned a bachelor's degree in political science from Harvard. About 38% of these graduates were women and the other 62% were men.
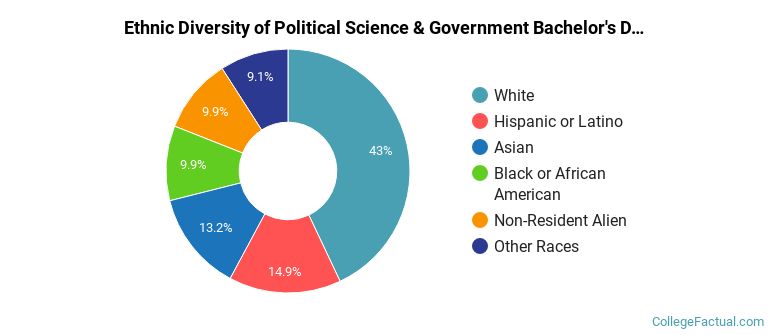
The following table and chart show the ethnic background for students who recently graduated from Harvard University with a bachelor's in political science.
| Ethnic Background | Number of Students |
|---|---|
| Asian | 16 |
| Black or African American | 12 |
| Hispanic or Latino | 18 |
| White | 52 |
| Non-Resident Aliens | 12 |
| Other Races | 11 |
Online degrees for the Harvard political science bachelor’s degree program are not available at this time. To see if the school offers distance learning options in other areas, visit the Harvard Online Learning page.
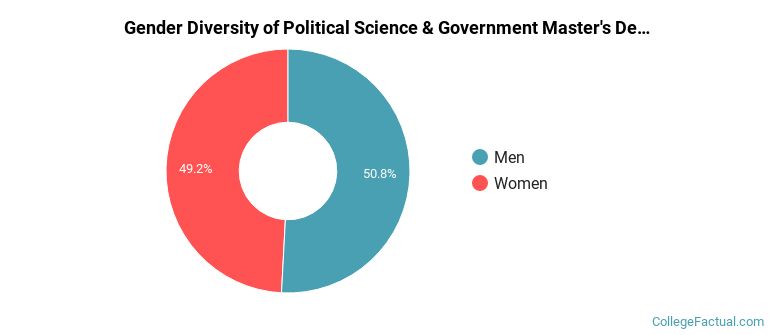
Of the 59 students who graduated with a Master’s in political science from Harvard in 2022, 51% were men and 49% were women.
The following table and chart show the ethnic background for students who recently graduated from Harvard University with a master's in political science.
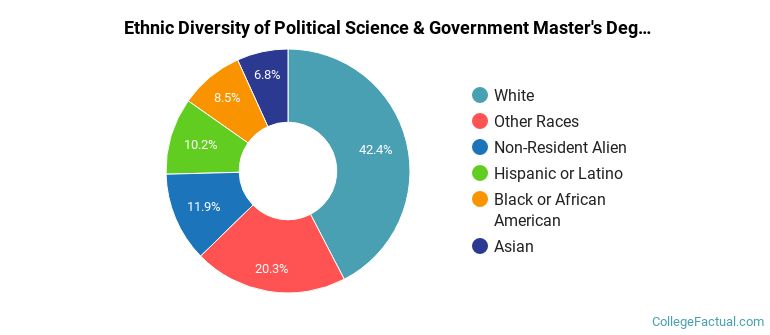
| Ethnic Background | Number of Students |
|---|---|
| Asian | 4 |
| Black or African American | 5 |
| Hispanic or Latino | 6 |
| White | 25 |
| Non-Resident Aliens | 7 |
| Other Races | 12 |
Take a look at the following statistics related to the make-up of the political science majors at Harvard University.
| Related Major | Annual Graduates |
|---|---|
| Economics | 332 |
| General Social Sciences | 195 |
| International Relations & National Security | 171 |
| Sociology | 65 |
| Anthropology | 53 |
More about our data sources and methodologies.
