Go directly to any of the following sections:
Ranked at #3 in College Factual's most recent rankings, Johns Hopkins is in the top 1% of the country for engineering students pursuing a bachelor's degree. It is also ranked #1 in Maryland.
During the 2021-2022 academic year, Johns Hopkins University handed out 304 bachelor's degrees in engineering. This is a decrease of 1% over the previous year when 306 degrees were handed out.
In 2022, 908 students received their master’s degree in engineering from Johns Hopkins. This makes it the #9 most popular school for engineering master’s degree candidates in the country.
In addition, 92 students received their doctoral degrees in engineering in 2022, making the school the #34 most popular school in the United States for this category of students.
Part-time undergraduates at Johns Hopkins paid an average of $2,095 per credit hour in 2022-2023. This tuition was the same for both in-state and out-of-state students. Information about average full-time undergraduate tuition and fees is shown in the table below.
| In State | Out of State | |
|---|---|---|
| Tuition | $62,840 | $62,840 |
| Books and Supplies | $1,345 | $1,345 |
| On Campus Room and Board | $19,910 | $19,910 |
| On Campus Other Expenses | $1,470 | $1,470 |
Learn more about Johns Hopkins tuition and fees.
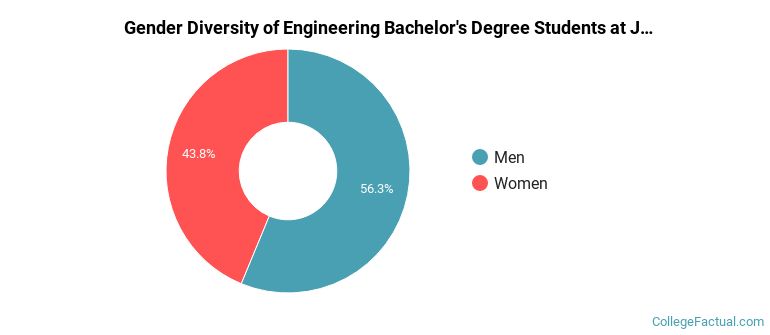
The engineering program at Johns Hopkins awarded 304 bachelor's degrees in 2021-2022. About 56% of these degrees went to men with the other 44% going to women.
The following table and chart show the ethnic background for students who recently graduated from Johns Hopkins University with a bachelor's in engineering.
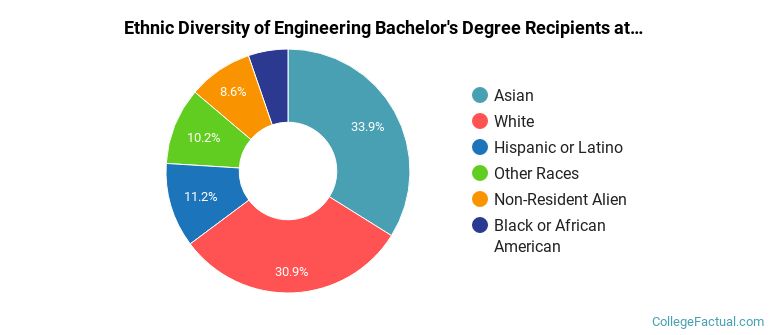
| Ethnic Background | Number of Students |
|---|---|
| Asian | 103 |
| Black or African American | 16 |
| Hispanic or Latino | 34 |
| White | 94 |
| Non-Resident Aliens | 26 |
| Other Races | 31 |
Johns Hopkins does not offer an online option for its engineering bachelor’s degree program at this time. To see if the school offers distance learning options in other areas, visit the Johns Hopkins Online Learning page.
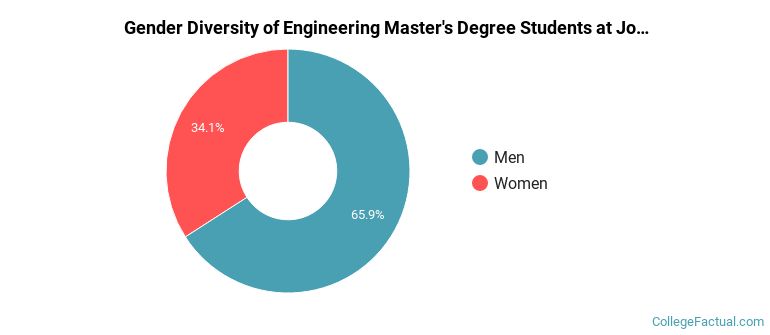
Of the 886 students who earned a master's degree in Engineering from Johns Hopkins in 2021-2022, 66% were men and 34% were women.
The following table and chart show the ethnic background for students who recently graduated from Johns Hopkins University with a master's in engineering.
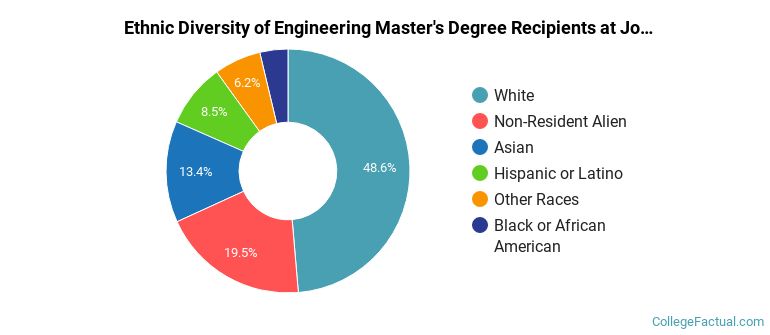
| Ethnic Background | Number of Students |
|---|---|
| Asian | 119 |
| Black or African American | 33 |
| Hispanic or Latino | 75 |
| White | 431 |
| Non-Resident Aliens | 173 |
| Other Races | 55 |
Take a look at the following statistics related to the make-up of the engineering majors at Johns Hopkins University.
Engineering students may decide to major in one of the following focus areas. Individual majors may not be available for all degree levels.
| Major | Annual Graduates |
|---|---|
| Biomedical Engineering | 370 |
| Electrical Engineering | 198 |
| Mechanical Engineering | 194 |
| Systems Engineering | 162 |
| Chemical Engineering | 127 |
| Aerospace & Aeronautical Engineering | 91 |
| Environmental Engineering | 69 |
| Materials Engineering | 64 |
| Civil Engineering | 42 |
| Robotics Engineering | 19 |
| Computer Engineering | 14 |
| General Engineering | 9 |
| Engineering Mechanics | 4 |
| Related Major | Annual Graduates |
|---|---|
| Biological & Biomedical Sciences | 1,207 |
| Mathematics & Statistics | 434 |
| Physical Sciences | 263 |
| Engineering Technologies | 81 |
| Military Technologies & Applied Sciences | 40 |
More about our data sources and methodologies.