We've pulled together some essential information you should know about the program, including how many students graduate each year, the ethnic diversity of these students, average starting salaries, and more. In addition, we cover how KSU Georgia ranks in comparison to other schools with political science programs.
Jump to any of the following sections:
Learn about start dates, transferring credits, availability of financial aid, and more by contacting the universities below.
Gain a solid understanding of American political history, the current political landscape, and the major political parties with this online bachelor's from Southern New Hampshire University.
The bachelor's program at KSU Georgia was ranked #445 on College Factual's Best Schools for political science list. It is also ranked #8 in Georgia.
| Ranking Type | Rank |
|---|---|
| Best Political Science & Government Bachelor’s Degree Schools | 433 |
| Best Political Science & Government Schools | 445 |
During the 2021-2022 academic year, Kennesaw State University handed out 92 bachelor's degrees in political science & government. This is a decrease of 23% over the previous year when 119 degrees were handed out.
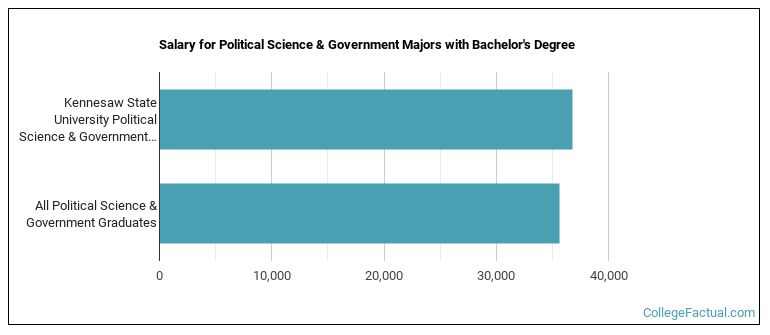
Political Science majors who earn their bachelor's degree from KSU Georgia go on to jobs where they make a median salary of $36,794 a year. This is higher than $35,631, which is the national median for all political science bachelor's degree recipients.
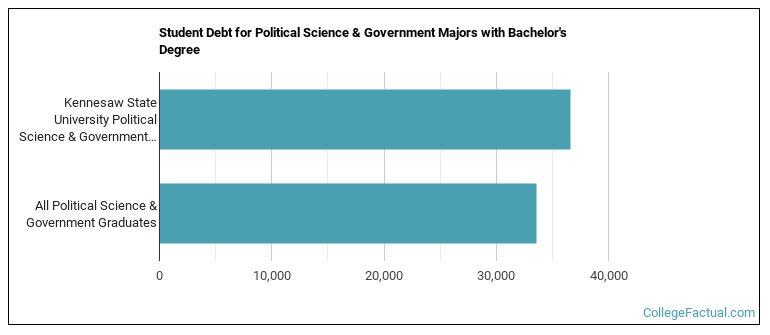
While getting their bachelor's degree at KSU Georgia, political science students borrow a median amount of $36,645 in student loans. This is higher than the the typical median of $33,583 for all political science majors across the country.
The typical student loan payment of a bachelor's degree student from the political science program at KSU Georgia is $498 per month.
In 2022-2023, the average part-time undergraduate tuition at KSU Georgia was $654 per credit hour for out-of-state students. The average for in-state students was $185 per credit hour. The following table shows the average full-time tuition and fees for undergraduates.
| In State | Out of State | |
|---|---|---|
| Tuition | $4,450 | $15,704 |
| Fees | $1,336 | $1,336 |
| Books and Supplies | $1,500 | $1,500 |
| On Campus Room and Board | $13,027 | $13,027 |
| On Campus Other Expenses | $5,614 | $5,614 |
Learn more about KSU Georgia tuition and fees.
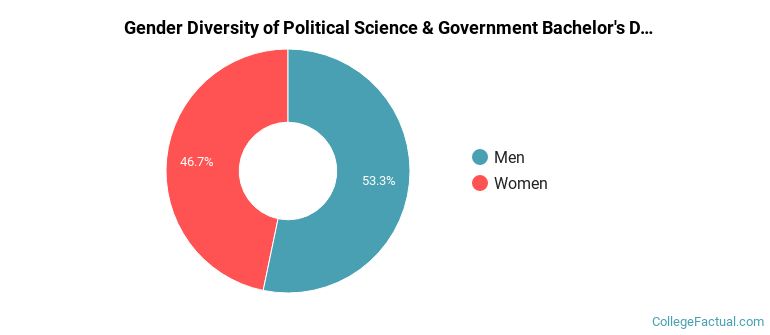
The political science program at KSU Georgia awarded 92 bachelor's degrees in 2021-2022. About 53% of these degrees went to men with the other 47% going to women.
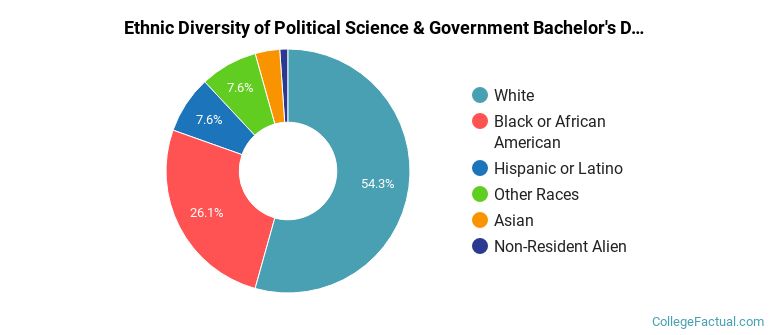
The majority of bachelor's degree recipients in this major at KSU Georgia are white. In the most recent graduating class for which data is available, 54% of students fell into this category.
The following table and chart show the ethnic background for students who recently graduated from Kennesaw State University with a bachelor's in political science.
| Ethnic Background | Number of Students |
|---|---|
| Asian | 3 |
| Black or African American | 24 |
| Hispanic or Latino | 7 |
| White | 50 |
| Non-Resident Aliens | 1 |
| Other Races | 7 |
KSU Georgia does not offer an online option for its political science bachelor’s degree program at this time. To see if the school offers distance learning options in other areas, visit the KSU Georgia Online Learning page.
Take a look at the following statistics related to the make-up of the political science majors at Kennesaw State University.
| Related Major | Annual Graduates |
|---|---|
| Sociology | 71 |
| Geography & Cartography | 52 |
| International Relations & National Security | 45 |
| Anthropology | 21 |
