We've pulled together some essential information you should know about the program, including how many students graduate each year, the ethnic diversity of these students, and more. Also, learn how Limestone College ranks among other schools offering degrees in it.
Jump to any of the following sections:
The bachelor's program at Limestone College was ranked #222 on College Factual's Best Schools for it list. It is also ranked #2 in South Carolina.
| Ranking Type | Rank |
|---|---|
| Best Information Technology Bachelor’s Degree Schools | 89 |
| Best Information Technology Schools | 222 |
During the 2021-2022 academic year, Limestone College handed out 24 bachelor's degrees in information technology. This is a decrease of 17% over the previous year when 29 degrees were handed out.
In 2022-2023, the average part-time undergraduate tuition at Limestone College was $1,050 per credit hour for both in-state and out-of-state students. Information about average full-time undergraduate tuition and fees is shown in the table below.
| In State | Out of State | |
|---|---|---|
| Tuition | $26,400 | $26,400 |
| Fees | $1,100 | $1,100 |
| Books and Supplies | $1,240 | $1,240 |
| On Campus Room and Board | $10,079 | $10,079 |
| On Campus Other Expenses | $2,940 | $2,940 |
Learn more about Limestone College tuition and fees.
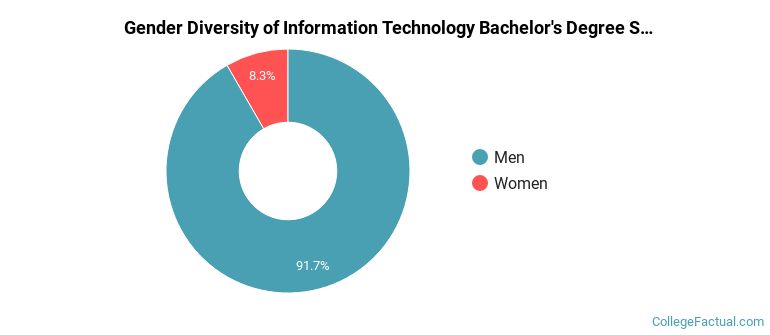
For the most recent academic year available, 92% of it bachelor's degrees went to men and 8% went to women.
The following table and chart show the ethnic background for students who recently graduated from Limestone College with a bachelor's in it.
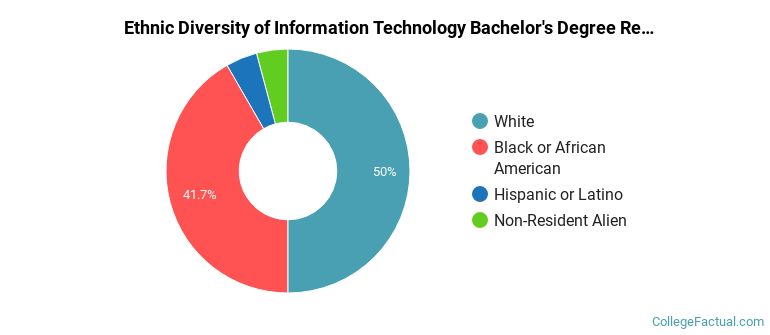
| Ethnic Background | Number of Students |
|---|---|
| Asian | 0 |
| Black or African American | 10 |
| Hispanic or Latino | 1 |
| White | 12 |
| Non-Resident Aliens | 1 |
| Other Races | 0 |
Online degrees for the Limestone College it bachelor’s degree program are not available at this time. To see if the school offers distance learning options in other areas, visit the Limestone College Online Learning page.
Take a look at the following statistics related to the make-up of the it majors at Limestone College.
| Related Major | Annual Graduates |
|---|---|
| Computer Programming | 17 |
| Computer Information Systems | 6 |
More about our data sources and methodologies.