Here, you'll find out more about the major, including such details as the number of graduates, what degree levels are offered, ethnicity of students, and more. We've also included details on how Maryville U ranks compared to other colleges offering a major in grade specific ed.
Go directly to any of the following sections:
The bachelor's program at Maryville U was ranked #496 on College Factual's Best Schools for grade specific ed list. It is also ranked #11 in Missouri.
| Ranking Type | Rank |
|---|---|
| Best Teacher Education Grade Specific Bachelor’s Degree Schools | 436 |
| Best Teacher Education Grade Specific Schools | 496 |
During the 2021-2022 academic year, Maryville University of Saint Louis handed out 35 bachelor's degrees in teacher education grade specific. This is an increase of 3% over the previous year when 34 degrees were handed out.
In 2022-2023, the average part-time undergraduate tuition at Maryville U was $781 per credit hour for both in-state and out-of-state students. The following table shows the average full-time tuition and fees for undergraduates.
| In State | Out of State | |
|---|---|---|
| Tuition | $24,766 | $24,766 |
| Fees | $2,400 | $2,400 |
| On Campus Room and Board | $13,300 | $13,300 |
| On Campus Other Expenses | $4,300 | $4,300 |
Learn more about Maryville U tuition and fees.
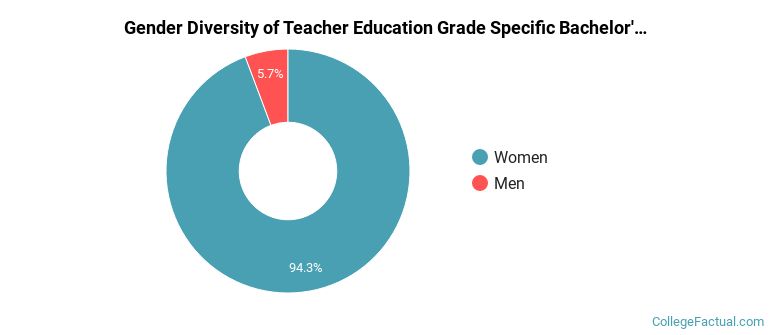
During the 2021-2022 academic year, 35 students graduated with a bachelor's degree in grade specific ed from Maryville U. About 6% were men and 94% were women.
The majority of the students with this major are white. About 74% of 2022 graduates were in this category.
The following table and chart show the ethnic background for students who recently graduated from Maryville University of Saint Louis with a bachelor's in grade specific ed.
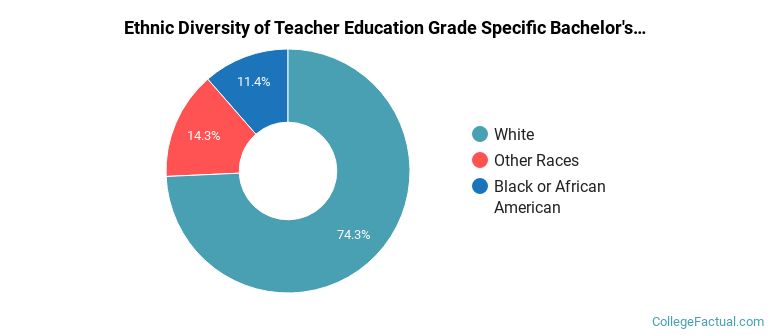
| Ethnic Background | Number of Students |
|---|---|
| Asian | 0 |
| Black or African American | 4 |
| Hispanic or Latino | 0 |
| White | 26 |
| Non-Resident Aliens | 0 |
| Other Races | 5 |
Online degrees for the Maryville U grade specific ed bachelor’s degree program are not available at this time. To see if the school offers distance learning options in other areas, visit the Maryville U Online Learning page.
Take a look at the following statistics related to the make-up of the grade specific ed majors at Maryville University of Saint Louis.
| Related Major | Annual Graduates |
|---|---|
| Educational Administration | 117 |
| General Education | 7 |
| Curriculum & Instruction | 6 |
More about our data sources and methodologies.