Jump to any of the following sections:
The bachelor's program at Ohio State was ranked #43 on College Factual's Best Schools for mathematics & statistics list. It is also ranked #1 in Ohio.
During the 2021-2022 academic year, Ohio State University - Main Campus handed out 355 bachelor's degrees in mathematics & statistics. This is an increase of 19% over the previous year when 299 degrees were handed out.
In 2022, 169 students received their master’s degree in mathematics & statistics from Ohio State. This makes it the #9 most popular school for mathematics & statistics master’s degree candidates in the country.
In addition, 21 students received their doctoral degrees in mathematics & statistics in 2022, making the school the #30 most popular school in the United States for this category of students.
Out-of-state part-time undergraduates at Ohio State paid an average of $1,556 per credit hour in 2022-2023. The average for in-state students was $493 per credit hour. The following table shows the average full-time tuition and fees for undergraduates.
| In State | Out of State | |
|---|---|---|
| Tuition | $11,826 | $37,332 |
| Fees | $1,033 | $1,033 |
| Books and Supplies | $1,030 | $1,030 |
| On Campus Room and Board | $14,272 | $14,272 |
| On Campus Other Expenses | $3,070 | $3,070 |
Learn more about Ohio State tuition and fees.
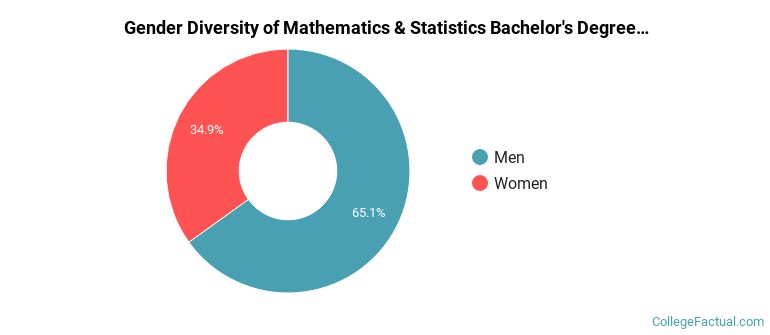
Of the 355 mathematics & statistics students who graduated with a bachelor's degree in 2021-2022 from Ohio State, about 65% were men and 35% were women.
The following table and chart show the ethnic background for students who recently graduated from Ohio State University - Main Campus with a bachelor's in mathematics & statistics.
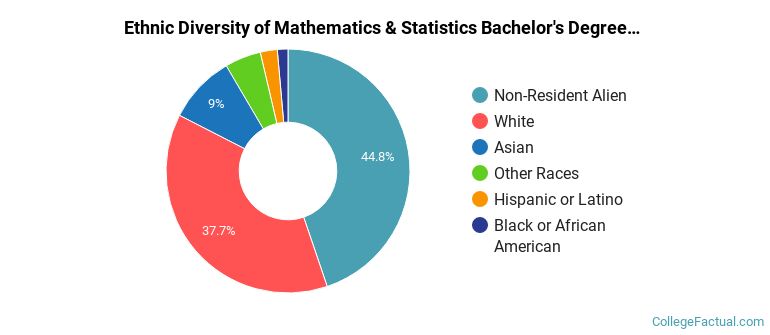
| Ethnic Background | Number of Students |
|---|---|
| Asian | 32 |
| Black or African American | 5 |
| Hispanic or Latino | 8 |
| White | 134 |
| Non-Resident Aliens | 159 |
| Other Races | 17 |
Ohio State does not offer an online option for its mathematics & statistics bachelor’s degree program at this time. To see if the school offers distance learning options in other areas, visit the Ohio State Online Learning page.
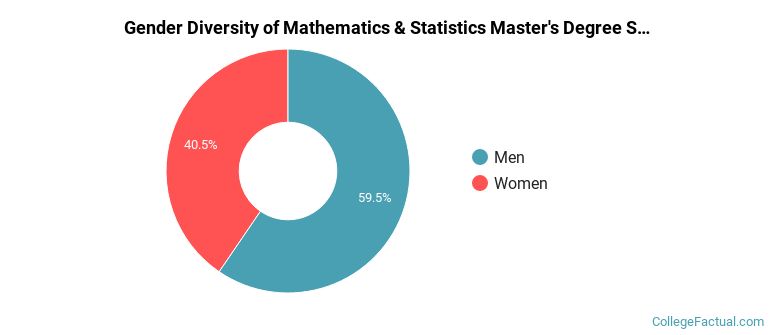
During the 2021-2022 academic year, 173 mathematics & statistics majors earned their master's degree from Ohio State. Of these graduates, 60% were men and 40% were women.
The following table and chart show the ethnic background for students who recently graduated from Ohio State University - Main Campus with a master's in mathematics & statistics.
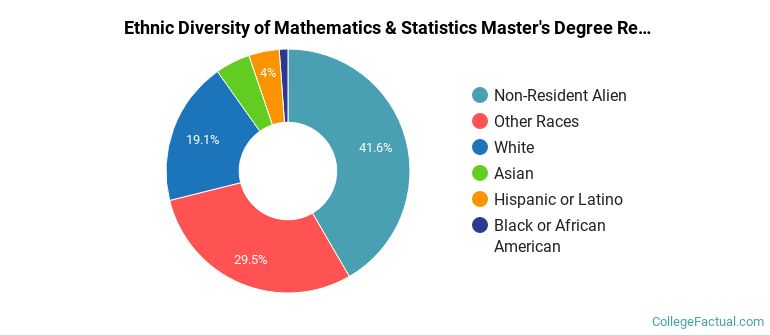
| Ethnic Background | Number of Students |
|---|---|
| Asian | 8 |
| Black or African American | 2 |
| Hispanic or Latino | 7 |
| White | 33 |
| Non-Resident Aliens | 72 |
| Other Races | 51 |
Take a look at the following statistics related to the make-up of the mathematics & statistics majors at Ohio State University - Main Campus.
Mathematics & Statistics students may decide to major in one of the following focus areas. Individual majors may not be available for all degree levels.
| Major | Annual Graduates |
|---|---|
| Mathematics | 246 |
| Applied Mathematics | 228 |
| Statistics | 87 |
| Related Major | Annual Graduates |
|---|---|
| Engineering | 2,203 |
| Biological & Biomedical Sciences | 1,242 |
| Agriculture & Agriculture Operations | 608 |
| Physical Sciences | 366 |
| Natural Resources & Conservation | 281 |
More about our data sources and methodologies.