Jump to any of the following sections:
Rice is in the top 10% of the country for mathematics & statistics. More specifically it was ranked #21 out of 275 schools by College Factual. It is also ranked #1 in Texas.
During the 2021-2022 academic year, Rice University handed out 78 bachelor's degrees in mathematics & statistics. This is a decrease of 6% over the previous year when 83 degrees were handed out.
In 2022, 39 students received their master’s degree in mathematics & statistics from Rice. This makes it the #86 most popular school for mathematics & statistics master’s degree candidates in the country.
In addition, 14 students received their doctoral degrees in mathematics & statistics in 2022, making the school the #49 most popular school in the United States for this category of students.
During the 2022-2023 academic year, part-time undergraduate students at Rice paid an average of $2,384 per credit hour. No discount was available for in-state students. Information about average full-time undergraduate tuition and fees is shown in the table below.
| In State | Out of State | |
|---|---|---|
| Tuition | $57,210 | $57,210 |
| Fees | $918 | $918 |
| Books and Supplies | $1,400 | $1,400 |
| On Campus Room and Board | $15,900 | $15,900 |
| On Campus Other Expenses | $2,850 | $2,850 |
Learn more about Rice tuition and fees.
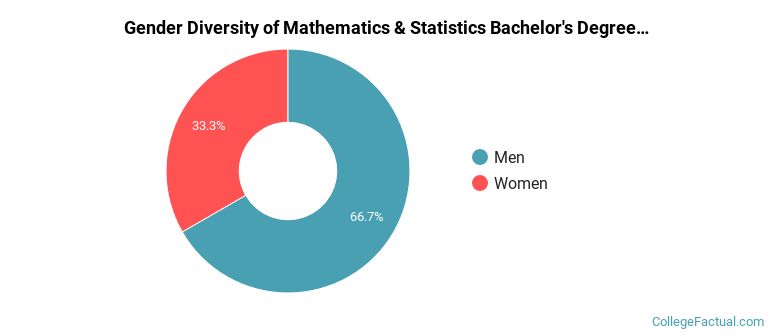
Of the 78 mathematics & statistics students who graduated with a bachelor's degree in 2021-2022 from Rice, about 67% were men and 33% were women.
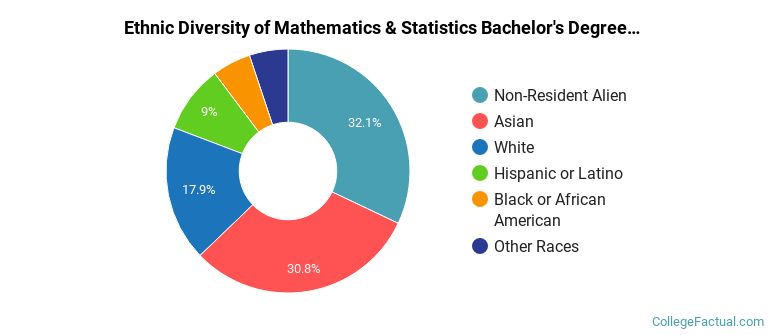
The following table and chart show the ethnic background for students who recently graduated from Rice University with a bachelor's in mathematics & statistics.
| Ethnic Background | Number of Students |
|---|---|
| Asian | 24 |
| Black or African American | 4 |
| Hispanic or Latino | 7 |
| White | 14 |
| Non-Resident Aliens | 25 |
| Other Races | 4 |
Rice does not offer an online option for its mathematics & statistics bachelor’s degree program at this time. To see if the school offers distance learning options in other areas, visit the Rice Online Learning page.
Of the 35 mathematics & statistics students who graduated with a master's degree in 2021-2022 from Rice, about 63% were men and 37% were women.

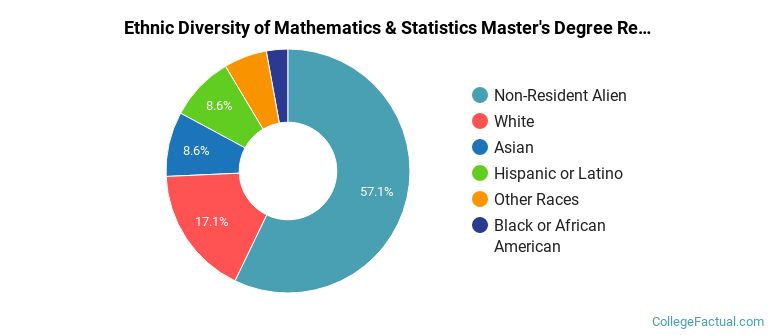
The following table and chart show the ethnic background for students who recently graduated from Rice University with a master's in mathematics & statistics.
| Ethnic Background | Number of Students |
|---|---|
| Asian | 3 |
| Black or African American | 1 |
| Hispanic or Latino | 3 |
| White | 6 |
| Non-Resident Aliens | 20 |
| Other Races | 2 |
Take a look at the following statistics related to the make-up of the mathematics & statistics majors at Rice University.
Mathematics & Statistics students may decide to major in one of the following focus areas. Individual majors may not be available for all degree levels.
| Major | Annual Graduates |
|---|---|
| Statistics | 71 |
| Mathematics | 40 |
| Applied Mathematics | 26 |
| Related Major | Annual Graduates |
|---|---|
| Engineering | 365 |
| Biological & Biomedical Sciences | 153 |
| Physical Sciences | 122 |
| Architecture & Related Services | 57 |
| Engineering Technologies | 27 |
More about our data sources and methodologies.