We've pulled together some essential information you should know about the program, including how many students graduate each year, the ethnic diversity of these students, and more. In addition, we cover how San Jose State ranks in comparison to other schools with engineering-related fields programs.
Go directly to any of the following sections:
The engineering-related fields major at San Jose State is not ranked on College Factual’s Best Colleges and Universities for Engineering-Related Fields. This could be for a number of reasons, such as not having enough data on the major or school to make an accurate assessment of its quality.
During the 2021-2022 academic year, San Jose State University handed out 13 bachelor's degrees in engineering-related fields. This is a decrease of 35% over the previous year when 20 degrees were handed out.
In 2022, 80 students received their master’s degree in engineering-related fields from San Jose State. This makes it the #13 most popular school for engineering-related fields master’s degree candidates in the country.
The following table shows the average full-time tuition and fees for undergraduates.
| In State | Out of State | |
|---|---|---|
| Tuition | $5,742 | $17,622 |
| Fees | $2,250 | $2,250 |
| Books and Supplies | $938 | $938 |
| On Campus Room and Board | $19,866 | $19,866 |
| On Campus Other Expenses | $3,514 | $3,514 |
Learn more about San Jose State tuition and fees.
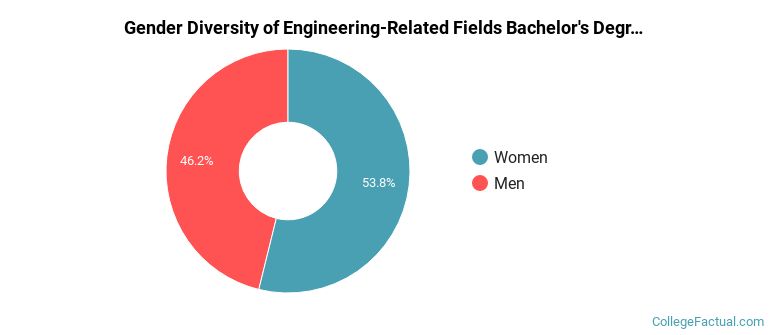
The engineering-related fields program at San Jose State awarded 13 bachelor's degrees in 2021-2022. About 46% of these degrees went to men with the other 54% going to women.
The following table and chart show the ethnic background for students who recently graduated from San Jose State University with a bachelor's in engineering-related fields.
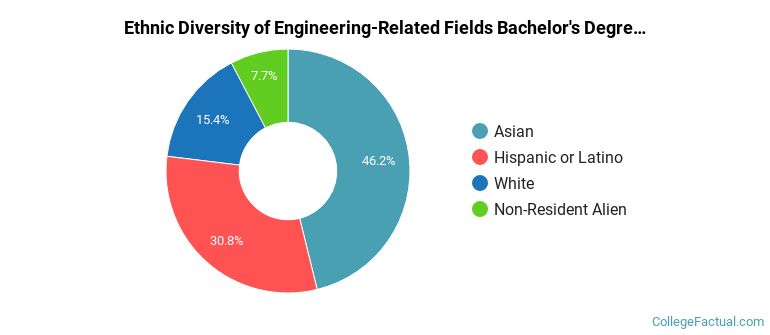
| Ethnic Background | Number of Students |
|---|---|
| Asian | 6 |
| Black or African American | 0 |
| Hispanic or Latino | 4 |
| White | 2 |
| Non-Resident Aliens | 1 |
| Other Races | 0 |
Online degrees for the San Jose State engineering-related fields bachelor’s degree program are not available at this time. To see if the school offers distance learning options in other areas, visit the San Jose State Online Learning page.
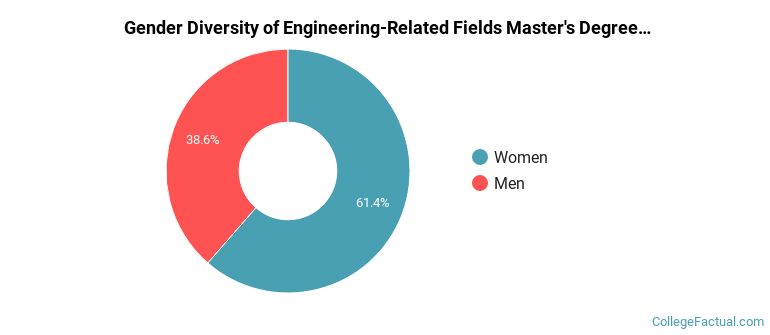
During the 2021-2022 academic year, 57 engineering-related fields majors earned their master's degree from San Jose State. Of these graduates, 39% were men and 61% were women.
The following table and chart show the ethnic background for students who recently graduated from San Jose State University with a master's in engineering-related fields.
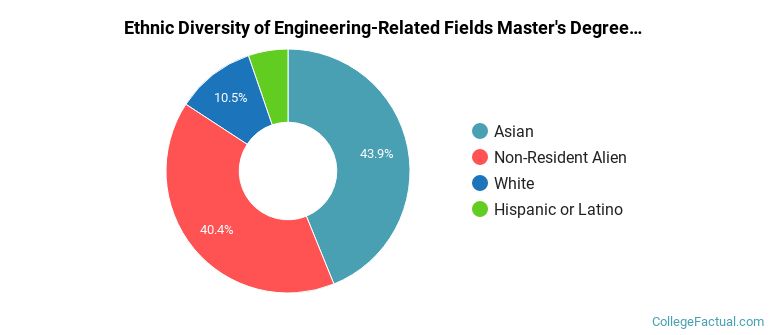
| Ethnic Background | Number of Students |
|---|---|
| Asian | 25 |
| Black or African American | 0 |
| Hispanic or Latino | 3 |
| White | 6 |
| Non-Resident Aliens | 23 |
| Other Races | 0 |
Take a look at the following statistics related to the make-up of the engineering-related fields majors at San Jose State University.
| Related Major | Annual Graduates |
|---|---|
| Industrial Production Technology | 58 |
| General Engineering Technology | 57 |
| Quality Control Technology | 13 |
More about our data sources and methodologies.