We've gathered data and other essential information about the program, such as the average salary of graduates, ethnicity of students, how many students graduated in recent times, and more. Also, learn how SPU ranks among other schools offering degrees in political science.
Jump to any of the following sections:
Learn about start dates, transferring credits, availability of financial aid, and more by contacting the universities below.
Gain a solid understanding of American political history, the current political landscape, and the major political parties with this online bachelor's from Southern New Hampshire University.
The bachelor's program at SPU was ranked #418 on College Factual's Best Schools for political science list. It is also ranked #11 in Washington.
| Ranking Type | Rank |
|---|---|
| Best Political Science & Government Bachelor’s Degree Schools | 407 |
| Best Political Science & Government Schools | 418 |
During the 2021-2022 academic year, Seattle Pacific University handed out 21 bachelor's degrees in political science & government. This is an increase of 75% over the previous year when 12 degrees were handed out.
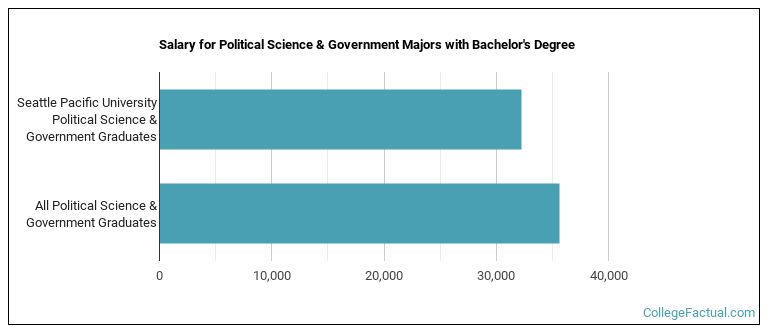
Political Science majors who earn their bachelor's degree from SPU go on to jobs where they make a median salary of $32,288 a year. Unfortunately, this is lower than the national average of $35,631 for all political science students.
During the 2022-2023 academic year, part-time undergraduate students at SPU paid an average of $1,055 per credit hour. No discount was available for in-state students. The following table shows the average full-time tuition and fees for undergraduates.
| In State | Out of State | |
|---|---|---|
| Tuition | $37,965 | $37,965 |
| Fees | $849 | $849 |
| Books and Supplies | $768 | $768 |
| On Campus Room and Board | $15,498 | $15,498 |
| On Campus Other Expenses | $3,888 | $3,888 |
Learn more about SPU tuition and fees.
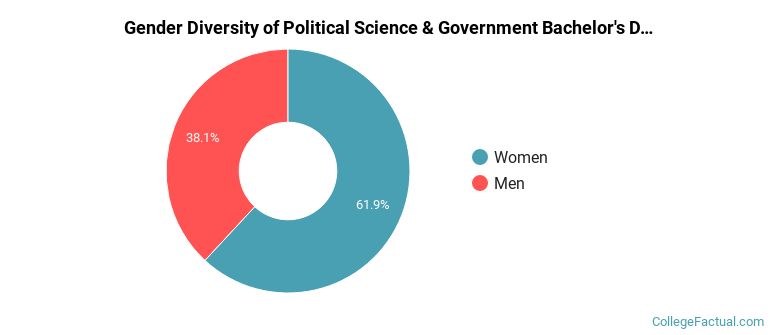
During the 2021-2022 academic year, 21 political science majors earned their bachelor's degree from SPU. Of these graduates, 38% were men and 62% were women.
The following table and chart show the ethnic background for students who recently graduated from Seattle Pacific University with a bachelor's in political science.
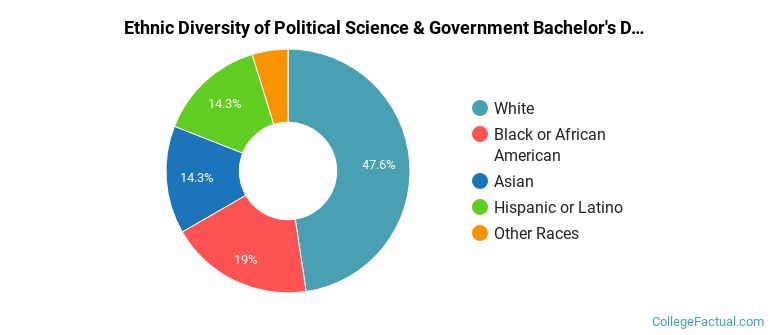
| Ethnic Background | Number of Students |
|---|---|
| Asian | 3 |
| Black or African American | 4 |
| Hispanic or Latino | 3 |
| White | 10 |
| Non-Resident Aliens | 0 |
| Other Races | 1 |
SPU does not offer an online option for its political science bachelor’s degree program at this time. To see if the school offers distance learning options in other areas, visit the SPU Online Learning page.
Take a look at the following statistics related to the make-up of the political science majors at Seattle Pacific University.
More about our data sources and methodologies.
