Jump to any of the following sections:
The bachelor's program at SD Mines was ranked #162 on College Factual's Best Schools for engineering list. It is also ranked #1 in South Dakota.
During the 2021-2022 academic year, South Dakota School of Mines and Technology handed out 287 bachelor's degrees in engineering. This is an increase of 13% over the previous year when 255 degrees were handed out.
In 2022, 82 students received their master’s degree in engineering from SD Mines. This makes it the #134 most popular school for engineering master’s degree candidates in the country.
In addition, 17 students received their doctoral degrees in engineering in 2022, making the school the #137 most popular school in the United States for this category of students.
In 2022-2023, the average part-time undergraduate tuition at SD Mines was $408 per credit hour for out-of-state students. The average for in-state students was $261 per credit hour. The average full-time tuition and fees for undergraduates are shown in the table below.
| In State | Out of State | |
|---|---|---|
| Tuition | $7,800 | $12,200 |
| Fees | $2,600 | $2,600 |
| Books and Supplies | $1,900 | $1,900 |
| On Campus Room and Board | $8,800 | $8,800 |
| On Campus Other Expenses | $5,000 | $5,000 |
Learn more about SD Mines tuition and fees.
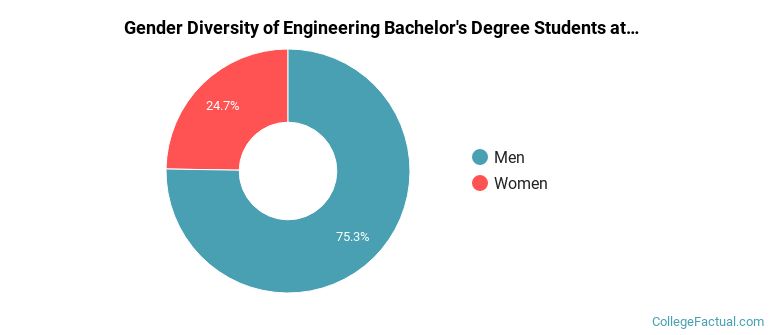
The engineering program at SD Mines awarded 287 bachelor's degrees in 2021-2022. About 75% of these degrees went to men with the other 25% going to women.
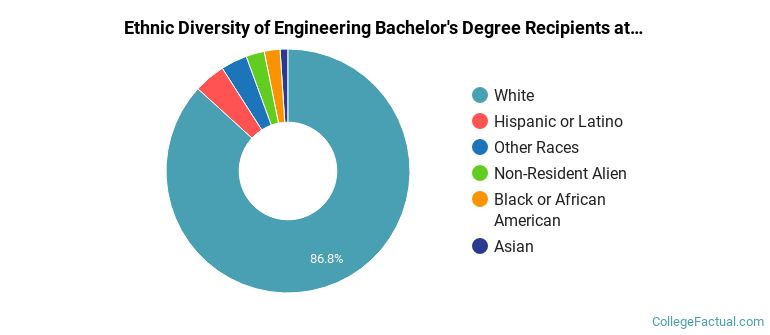
The majority of the students with this major are white. About 87% of 2022 graduates were in this category.
The following table and chart show the ethnic background for students who recently graduated from South Dakota School of Mines and Technology with a bachelor's in engineering.
| Ethnic Background | Number of Students |
|---|---|
| Asian | 3 |
| Black or African American | 6 |
| Hispanic or Latino | 12 |
| White | 249 |
| Non-Resident Aliens | 7 |
| Other Races | 10 |
Online degrees for the SD Mines engineering bachelor’s degree program are not available at this time. To see if the school offers distance learning options in other areas, visit the SD Mines Online Learning page.
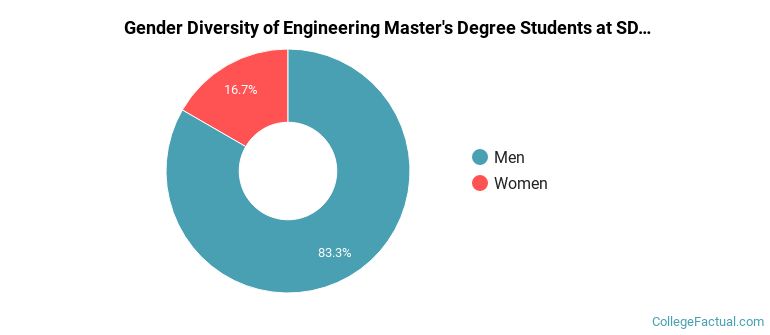
Of the 90 students who earned a master's degree in Engineering from SD Mines in 2021-2022, 83% were men and 17% were women.
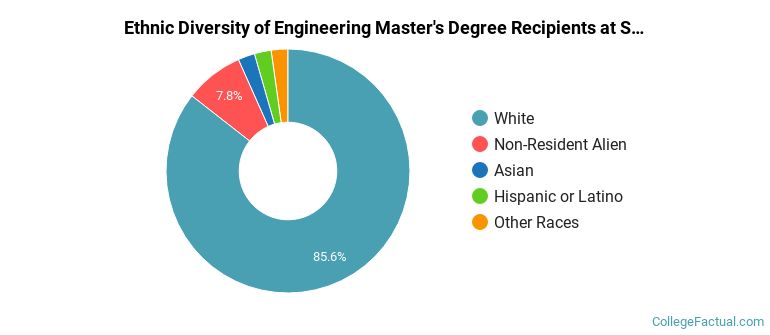
The majority of master's degree recipients in this major at SD Mines are white. In the most recent graduating class for which data is available, 86% of students fell into this category.
The following table and chart show the ethnic background for students who recently graduated from South Dakota School of Mines and Technology with a master's in engineering.
| Ethnic Background | Number of Students |
|---|---|
| Asian | 2 |
| Black or African American | 0 |
| Hispanic or Latino | 2 |
| White | 77 |
| Non-Resident Aliens | 7 |
| Other Races | 2 |
Take a look at the following statistics related to the make-up of the engineering majors at South Dakota School of Mines and Technology.
Engineering students may decide to major in one of the following focus areas. Individual majors may not be available for all degree levels.
| Major | Annual Graduates |
|---|---|
| Mechanical Engineering | 110 |
| Civil Engineering | 76 |
| Industrial Engineering | 46 |
| Electrical Engineering | 45 |
| Chemical Engineering | 33 |
| Mining Engineering | 23 |
| Computer Engineering | 17 |
| Biomedical Engineering | 16 |
| Geoscience Engineering | 16 |
| Materials Engineering | 13 |
| Construction Engineering | 13 |
| Metallurgical Engineering | 10 |
| Other Engineering | 1 |
| Related Major | Annual Graduates |
|---|---|
| Physical Sciences | 37 |
| Engineering Technologies | 24 |
| Mathematics & Statistics | 15 |
| Biological & Biomedical Sciences | 5 |