We've pulled together some essential information you should know about the program, including how many students graduate each year, the ethnic diversity of these students, and more. Also, learn how SCU ranks among other schools offering degrees in liberal arts.
Jump to any of the following sections:
The liberal arts major at SCU is not ranked on College Factual’s Best Colleges and Universities for Liberal Arts General Studies. This could be for a number of reasons, such as not having enough data on the major or school to make an accurate assessment of its quality.
During the 2021-2022 academic year, Southwestern Christian University handed out 3 bachelor's degrees in liberal arts general studies. This is an increase of 50% over the previous year when 2 degrees were handed out.
Learn about other programs related to Liberal Arts General Studies that might interest you.
Maximize your transfer credits and complete your bachelor's degree faster with this flexible online bachelor's from Southern New Hampshire University.
Part-time undergraduates at SCU paid an average of $568 per credit hour in 2022-2023. This tuition was the same for both in-state and out-of-state students. The average full-time tuition and fees for undergraduates are shown in the table below.
| In State | Out of State | |
|---|---|---|
| Tuition | $16,323 | $16,323 |
| Fees | $4,200 | $4,200 |
| Books and Supplies | $2,000 | $2,000 |
| On Campus Room and Board | $9,400 | $9,400 |
| On Campus Other Expenses | $2,338 | $2,338 |
Learn more about SCU tuition and fees.
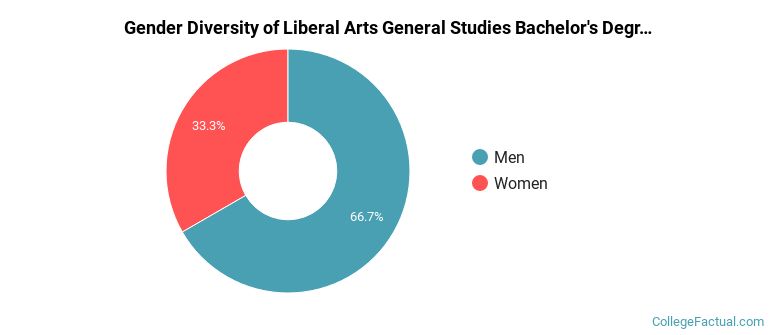
Of the 3 liberal arts students who graduated with a bachelor's degree in 2021-2022 from SCU, about 67% were men and 33% were women.
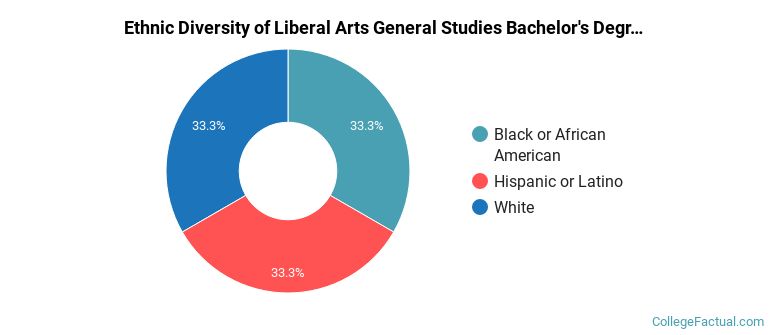
The following table and chart show the ethnic background for students who recently graduated from Southwestern Christian University with a bachelor's in liberal arts.
| Ethnic Background | Number of Students |
|---|---|
| Asian | 0 |
| Black or African American | 1 |
| Hispanic or Latino | 1 |
| White | 1 |
| Non-Resident Aliens | 0 |
| Other Races | 0 |
Online degrees for the SCU liberal arts bachelor’s degree program are not available at this time. To see if the school offers distance learning options in other areas, visit the SCU Online Learning page.
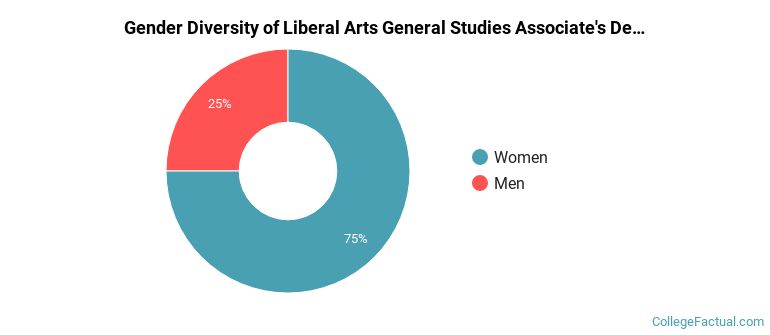
Of the 4 students who earned an associate's degree in Liberal Arts General Studies from SCU in 2021-2022, 25% were men and 75% were women.
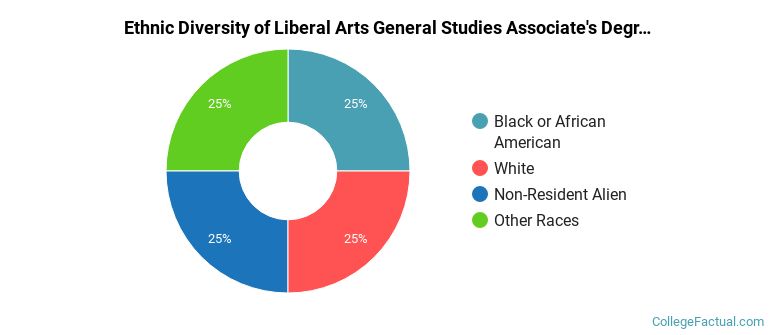
The following table and chart show the ethnic background for students who recently graduated from Southwestern Christian University with a associate's in liberal arts.
| Ethnic Background | Number of Students |
|---|---|
| Asian | 0 |
| Black or African American | 1 |
| Hispanic or Latino | 0 |
| White | 1 |
| Non-Resident Aliens | 1 |
| Other Races | 1 |
Take a look at the following statistics related to the make-up of the liberal arts majors at Southwestern Christian University.
More about our data sources and methodologies.
