Here, you'll find out more about the major, including such details as the number of graduates, what degree levels are offered, ethnicity of students, and more. Also, learn how Union ranks among other schools offering degrees in business administration.
Go directly to any of the following sections:
The bachelor's program at Union was ranked #634 on College Factual's Best Schools for business administration list. It is also ranked #24 in Ohio.
During the 2021-2022 academic year, Union Institute & University handed out 13 bachelor's degrees in business administration & management. This is an increase of 18% over the previous year when 11 degrees were handed out.
In 2022, 20 students received their master’s degree in business administration from Union. This makes it the #834 most popular school for business administration master’s degree candidates in the country.
During the 2022-2023 academic year, part-time undergraduate students at Union paid an average of $395 per credit hour. No discount was available for in-state students. The average full-time tuition and fees for undergraduates are shown in the table below.
| In State | Out of State | |
|---|---|---|
| Tuition | $13,880 | $13,880 |
| Fees | $450 | $450 |
| Books and Supplies | $1,216 | $1,216 |
Learn more about Union tuition and fees.
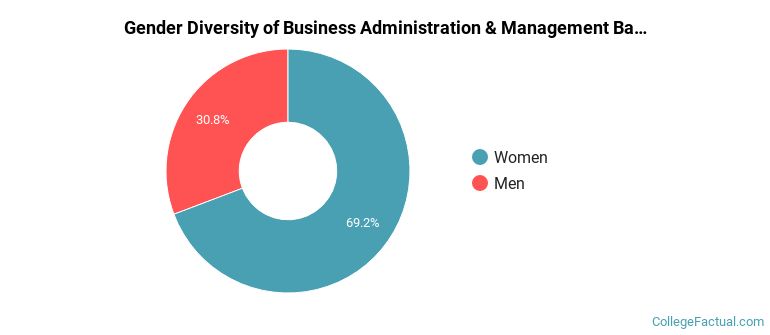
The business administration program at Union awarded 13 bachelor's degrees in 2021-2022. About 31% of these degrees went to men with the other 69% going to women.
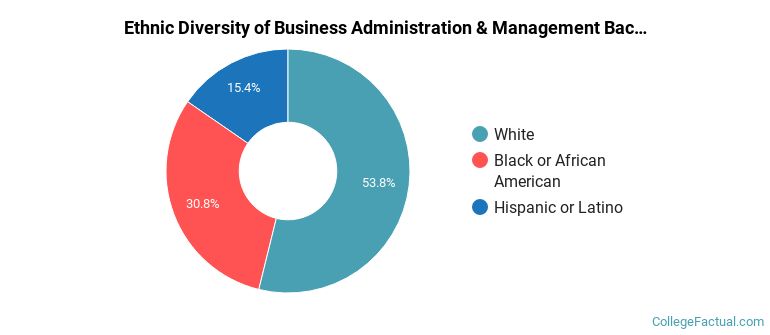
The majority of the students with this major are white. About 54% of 2022 graduates were in this category.
The following table and chart show the ethnic background for students who recently graduated from Union Institute & University with a bachelor's in business administration.
| Ethnic Background | Number of Students |
|---|---|
| Asian | 0 |
| Black or African American | 4 |
| Hispanic or Latino | 2 |
| White | 7 |
| Non-Resident Aliens | 0 |
| Other Races | 0 |
Online degrees for the Union business administration bachelor’s degree program are not available at this time. To see if the school offers distance learning options in other areas, visit the Union Online Learning page.
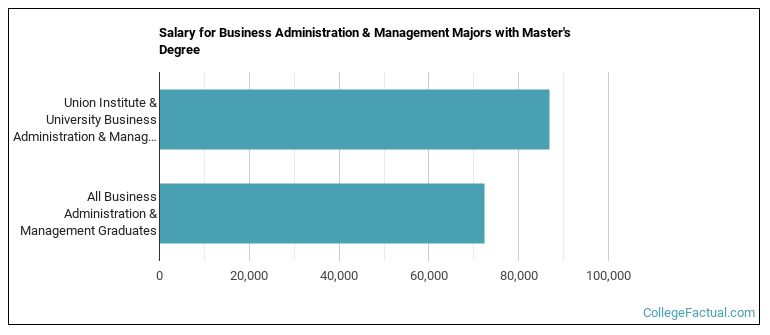
Business Administration majors graduating with a master's degree from Union make a median salary of $86,919 a year. This is a better than average outcome since the median salary for all business administration graduates with a master's is $72,329.
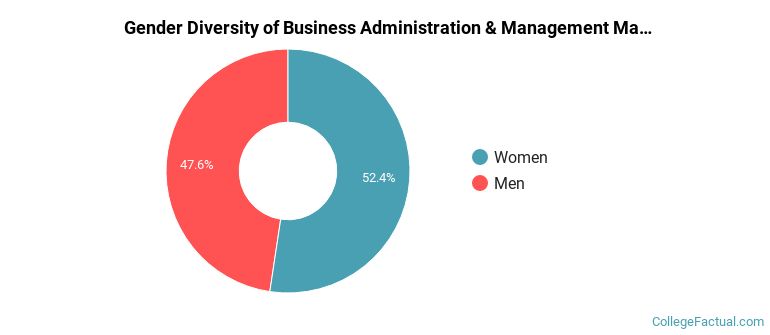
During the 2021-2022 academic year, 21 business administration majors earned their master's degree from Union. Of these graduates, 48% were men and 52% were women.
The following table and chart show the ethnic background for students who recently graduated from Union Institute & University with a master's in business administration.
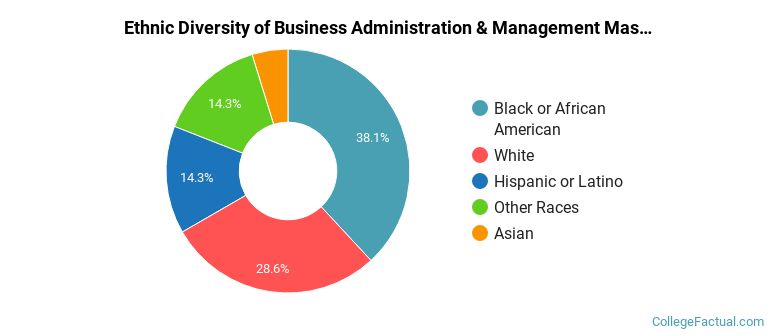
| Ethnic Background | Number of Students |
|---|---|
| Asian | 1 |
| Black or African American | 8 |
| Hispanic or Latino | 3 |
| White | 6 |
| Non-Resident Aliens | 0 |
| Other Races | 3 |
Take a look at the following statistics related to the make-up of the business administration majors at Union Institute & University.
More about our data sources and methodologies.