We've gathered data and other essential information about the program, such as the average salary of graduates, ethnicity of students, how many students graduated in recent times, and more. We've also included details on how University of Arizona ranks compared to other colleges offering a major in ee.
Go directly to any of the following sections:
The bachelor's program at University of Arizona was ranked #74 on College Factual's Best Schools for ee list. It is also ranked #2 in Arizona.
During the 2021-2022 academic year, University of Arizona handed out 101 bachelor's degrees in electrical engineering. This is an increase of 7% over the previous year when 94 degrees were handed out.
In 2022, 79 students received their master’s degree in ee from University of Arizona. This makes it the #30 most popular school for ee master’s degree candidates in the country.
In addition, 20 students received their doctoral degrees in ee in 2022, making the school the #35 most popular school in the United States for this category of students.
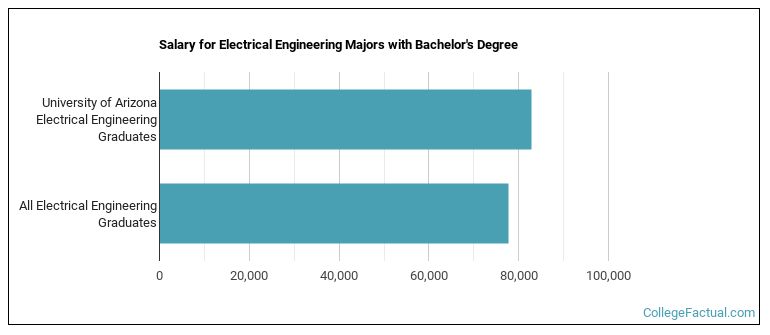
The median salary of ee students who receive their bachelor's degree at University of Arizona is $82,864. This is higher than $77,687, which is the national median for all ee bachelor's degree recipients.
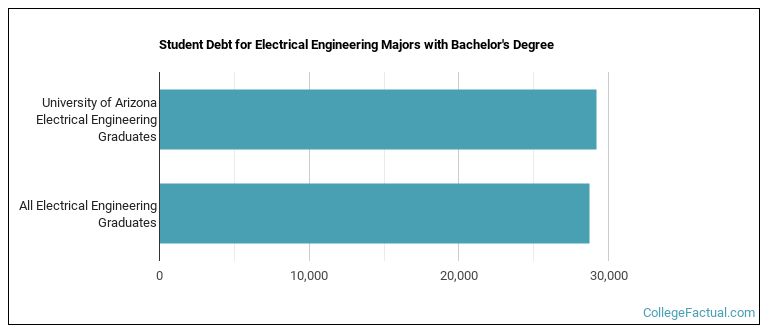
While getting their bachelor's degree at University of Arizona, ee students borrow a median amount of $29,169 in student loans. This is higher than the the typical median of $28,750 for all ee majors across the country.
In 2022-2023, the average part-time undergraduate tuition at University of Arizona was $1,544 per credit hour for out-of-state students. The average for in-state students was $825 per credit hour. The following table shows the average full-time tuition and fees for undergraduates.
| In State | Out of State | |
|---|---|---|
| Tuition | $11,546 | $37,053 |
| Fees | $1,731 | $1,731 |
| Books and Supplies | $800 | $800 |
| On Campus Room and Board | $14,400 | $14,400 |
| On Campus Other Expenses | $4,300 | $4,300 |
Learn more about University of Arizona tuition and fees.
For the most recent academic year available, 81% of ee bachelor's degrees went to men and 19% went to women.

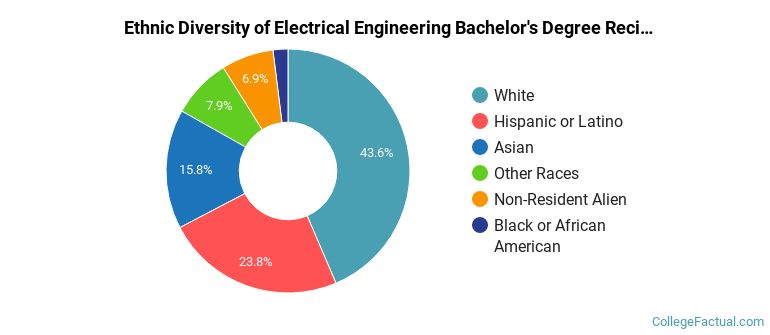
The following table and chart show the ethnic background for students who recently graduated from University of Arizona with a bachelor's in ee.
| Ethnic Background | Number of Students |
|---|---|
| Asian | 16 |
| Black or African American | 2 |
| Hispanic or Latino | 24 |
| White | 44 |
| Non-Resident Aliens | 7 |
| Other Races | 8 |
University of Arizona does not offer an online option for its ee bachelor’s degree program at this time. To see if the school offers distance learning options in other areas, visit the University of Arizona Online Learning page.
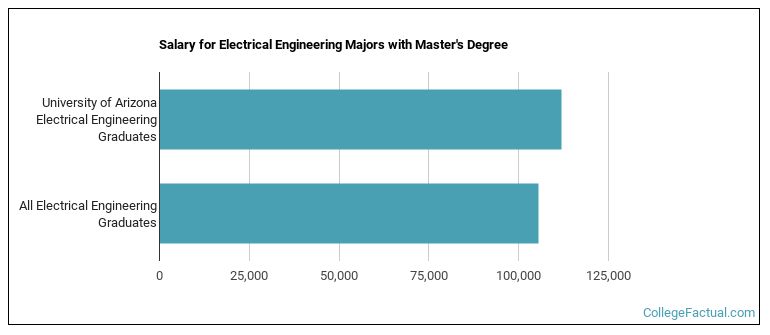
EE majors graduating with a master's degree from University of Arizona make a median salary of $111,792 a year. This is a better than average outcome since the median salary for all ee graduates with a master's is $105,380.
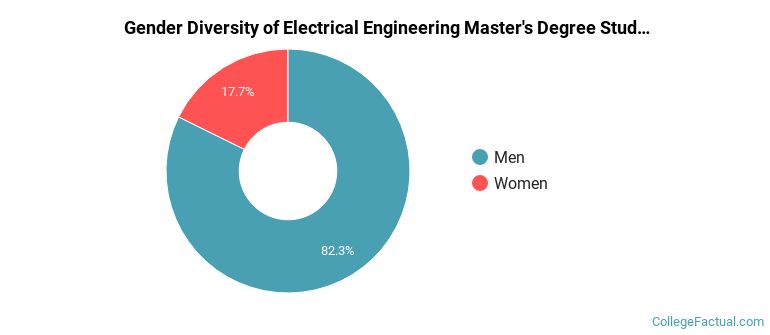
During the 2021-2022 academic year, 96 ee majors earned their master's degree from University of Arizona. Of these graduates, 82% were men and 18% were women.
The following table and chart show the ethnic background for students who recently graduated from University of Arizona with a master's in ee.
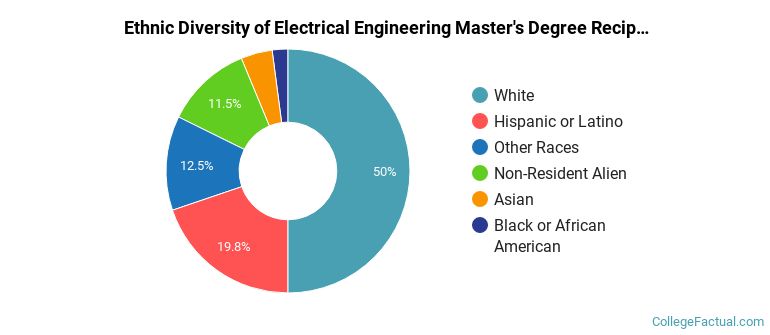
| Ethnic Background | Number of Students |
|---|---|
| Asian | 4 |
| Black or African American | 2 |
| Hispanic or Latino | 19 |
| White | 48 |
| Non-Resident Aliens | 11 |
| Other Races | 12 |
Take a look at the following statistics related to the make-up of the ee majors at University of Arizona.
| Related Major | Annual Graduates |
|---|---|
| Mechanical Engineering | 121 |
| Biomedical Engineering | 75 |
| Systems Engineering | 73 |
| Chemical Engineering | 62 |
| Aerospace & Aeronautical Engineering | 51 |
More about our data sources and methodologies.