Explore the best ranked schools for the programs you are most interested in.
UB is ranked #808 out of 2,152 schools in the nation for overall quality on College Factual's 2025 Best Colleges list. This is an improvement over the previous year, when UB held the #1,058 spot on the Best Overall Colleges list.
UB also holds the #19 spot on the Best Colleges in Maryland ranking.
The acceptance rate at University of Baltimore is 89%, which is higher than many other schools to which you may be applying. But don't think getting into UB is a sure thing. The admissions staff is still going to review your application to see if you are a good fit for the school.
About 23% of students accepted to UB submitted their SAT scores. When looking at the 25th through the 75th percentile, SAT Evidence-Based Reading and Writing scores ranged between 470 and 540. Math scores were between 450 and 510.
At UB, the student to faculty ratio is an excellent 10 to 1. That's much better than the national average of 15 to 1. This indicates that many classes will probably be small, and students will have ample opportunites to work closely with their professors and classmates.
When estimating how much access students will have to their teachers, some people like to look at what percentage of faculty members are full time. This is because part-time teachers may not have as much time to spend on campus as their full-time counterparts.
The full-time faculty percentage at University of Baltimore is 58%. This is higher than the national average of 47%.
The freshmen retention rate is a sign of how many full-time students like a college or university well enough to come back for their sophomore year. At University of Baltimore this rate is 60%, which is a bit lower than the national average of 68%.
The on-time graduation rate is the percent of first-time, full time students who obtain their bachelor's degree in four years or less. This rate is 20% for first-time, full-time students at UB, which is lower than the national rate of 33.3%.
Find out more about the retention and graduation rates at University of Baltimore.
During the 2017-2018 academic year, there were 1,899 undergraduates at UB with 1,050 being full-time and 849 being part-time.
| $0-30 K | $30K-48K | $48-75 | $75-110K | $110K + |
|---|---|---|---|---|
| $15,324 | $16,555 | $17,411 | $20,780 | $23,198 |
The net price is calculated by adding tuition, room, board and other costs and subtracting financial aid.Note that the net price is typically less than the published for a school. For more information on the sticker price of UB, see our tuition and fees and room and board pages.
While almost two-thirds of students nationwide take out loans to pay for college, the percentage may be quite different for the school you plan on attending. At UB, approximately 32% of students took out student loans averaging $5,118 a year. That adds up to $20,472 over four years for those students.
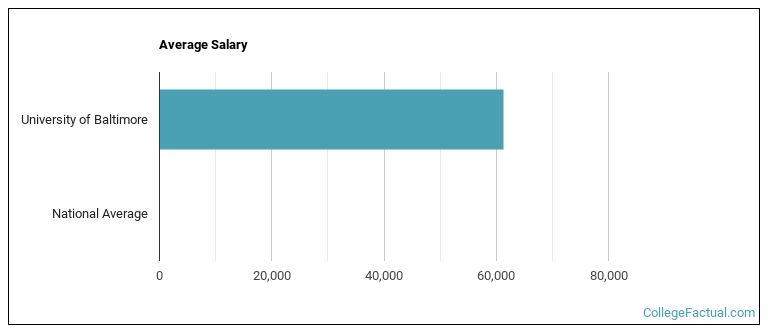
See which majors at University of Baltimore make the most money.
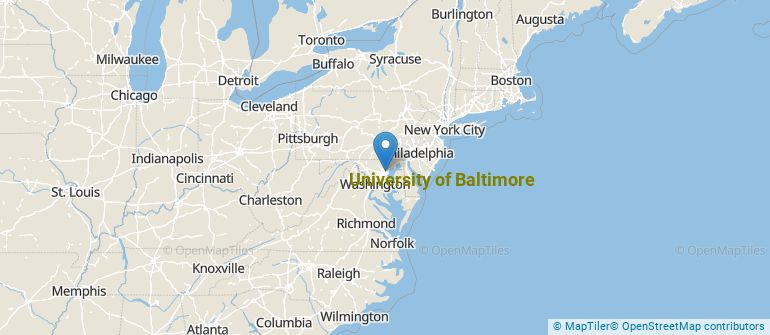
Get more details about the location of University of Baltimore.
Contact details for UB are given below.
| Contact Details | |
|---|---|
| Address: | Charles At Mount Royal, Baltimore, MD 21201-5720 |
| Phone: | 410-837-4200 |
| Website: | www.ubalt.edu/ |
| Most Popular Majors | Bachelor’s Degrees | Average Salary of Graduates |
|---|---|---|
| Law | 195 | NA |
| General Business/Commerce | 129 | $52,329 |
| Business Administration & Management | 116 | NA |
| Criminal Justice & Corrections | 60 | $48,991 |
| Public Administration | 53 | NA |
| Human Services | 39 | $39,099 |
| Behavioral Science | 35 | NA |
| Computer Software & Applications | 34 | NA |
| Security Science and Technology | 33 | NA |
| Accounting | 32 | NA |
Online courses area a great option for busy, working students as well as for those who have scheduling conflicts and want to study on their own time. As time goes by, expect to see more and more online learning options become available.
In 2022-2023, 2,203 students took at least one online class at University of Baltimore. This is a decrease from the 2,890 students who took online classes the previous year.
| Year | Took at Least One Online Class | Took All Classes Online |
|---|---|---|
| 2022-2023 | 2,203 | 1,050 |
| 2021-2022 | 2,890 | 2,325 |
| 2020-2021 | 4,169 | 4,169 |
| 2018-2019 | 2,419 | 817 |
Learn more about online learning at University of Baltimore.
If you’re considering University of Baltimore, here are some more schools you may be interested in knowing more about.
Curious on how these schools stack up against UB? Pit them head to head with College Combat, our free interactive tool that lets you compare college on the features that matter most to you!
Footnotes
*The racial-ethnic minorities count is calculated by taking the total number of students and subtracting white students, international students, and students whose race/ethnicity was unknown. This number is then divided by the total number of students at the school to obtain the racial-ethnic minorities percentage.
References
More about our data sources and methodologies.