Here, you'll find out more about the major, including such details as the number of graduates, what degree levels are offered, ethnicity of students, and more. Also, learn how UB ranks among other schools offering degrees in public admin.
Jump to any of the following sections:
The bachelor's program at UB was ranked #67 on College Factual's Best Schools for public admin list.
In 2022, 64 students received their master’s degree in public admin from UB. This makes it the #52 most popular school for public admin master’s degree candidates in the country.
Out-of-state part-time undergraduates at UB paid an average of $1,074 per credit hour in 2022-2023. The average for in-state students was $338 per credit hour. The average full-time tuition and fees for undergraduates are shown in the table below.
| In State | Out of State | |
|---|---|---|
| Tuition | $7,442 | $21,160 |
| Fees | $2,330 | $2,330 |
| Books and Supplies | $1,600 | $1,600 |
Learn more about UB tuition and fees.
Online degrees for the UB public admin bachelor’s degree program are not available at this time. To see if the school offers distance learning options in other areas, visit the UB Online Learning page.
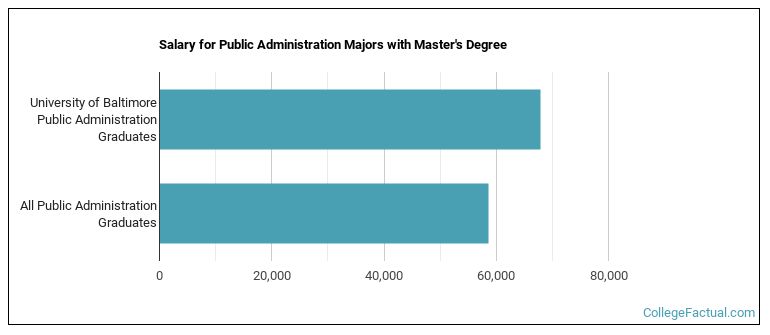
Graduates of the master's public admin program at UB make a median salary of $67,870. This is a better than average outcome since the median salary for all public admin graduates with a master's is $58,617.
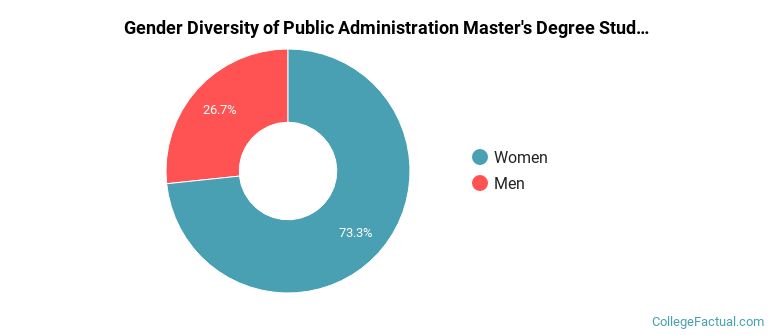
Of the 45 students who graduated with a Master’s in public admin from UB in 2022, 27% were men and 73% were women.
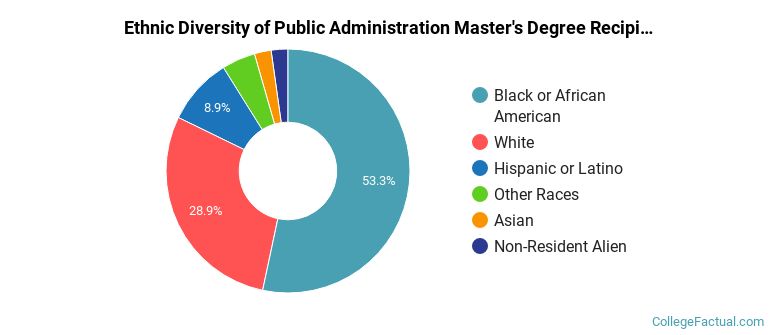
The majority of the master's degree graduates for this major are black or African Americans. About 53% of grads fell into this category.
The following table and chart show the ethnic background for students who recently graduated from University of Baltimore with a master's in public admin.
| Ethnic Background | Number of Students |
|---|---|
| Asian | 1 |
| Black or African American | 24 |
| Hispanic or Latino | 4 |
| White | 13 |
| Non-Resident Aliens | 1 |
| Other Races | 2 |
Take a look at the following statistics related to the make-up of the public admin majors at University of Baltimore.
| Related Major | Annual Graduates |
|---|---|
| Human Services | 39 |
More about our data sources and methodologies.