Jump to any of the following sections:
UCR was ranked #74 on College Factual's most recent list of the best schools for visual & performing arts majors. This puts the bachelor's program at the school solidly in the top 15% of all colleges and universities in the country. It is also ranked #13 in California.
| Ranking Type | Rank |
|---|---|
| Best Visual & Performing Arts Bachelor’s Degree Schools | 73 |
| Best Visual & Performing Arts Schools | 74 |
During the 2021-2022 academic year, University of California - Riverside handed out 282 bachelor's degrees in visual & performing arts. This is a decrease of 6% over the previous year when 299 degrees were handed out.
In 2022, 8 students received their master’s degree in visual & performing arts from UCR. This makes it the #316 most popular school for visual & performing arts master’s degree candidates in the country.
In addition, 4 students received their doctoral degrees in visual & performing arts in 2022, making the school the #87 most popular school in the United States for this category of students.
The following table shows the average full-time tuition and fees for undergraduates.
| In State | Out of State | |
|---|---|---|
| Tuition | $11,834 | $42,611 |
| Fees | $2,336 | $2,336 |
| Books and Supplies | $1,748 | $1,748 |
| On Campus Room and Board | $19,433 | $19,433 |
| On Campus Other Expenses | $4,934 | $4,934 |
Learn more about UCR tuition and fees.
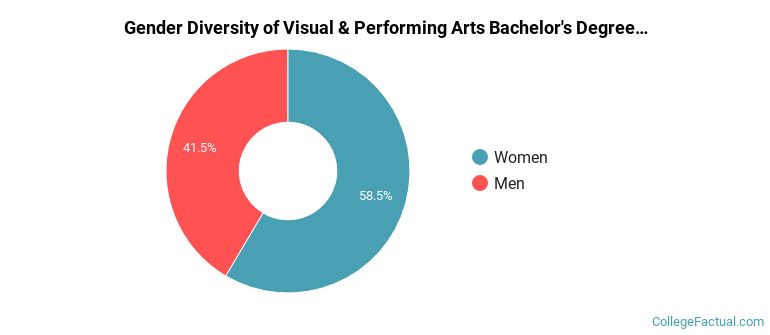
Of the 282 students who earned a bachelor's degree in Visual & Performing Arts from UCR in 2021-2022, 41% were men and 59% were women.
The following table and chart show the ethnic background for students who recently graduated from University of California - Riverside with a bachelor's in visual & performing arts.
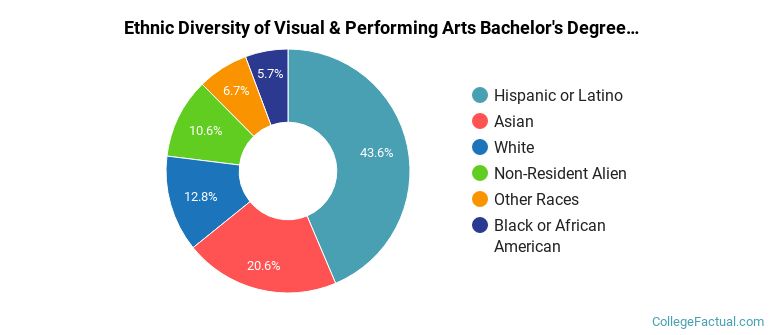
| Ethnic Background | Number of Students |
|---|---|
| Asian | 58 |
| Black or African American | 16 |
| Hispanic or Latino | 123 |
| White | 36 |
| Non-Resident Aliens | 30 |
| Other Races | 19 |
UCR does not offer an online option for its visual & performing arts bachelor’s degree program at this time. To see if the school offers distance learning options in other areas, visit the UCR Online Learning page.
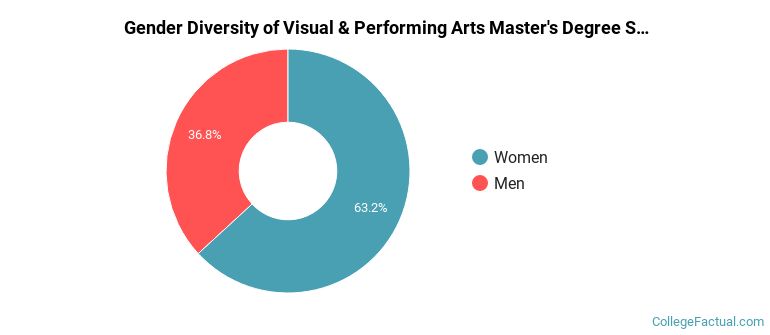
During the 2021-2022 academic year, 19 visual & performing arts majors earned their master's degree from UCR. Of these graduates, 37% were men and 63% were women.
The following table and chart show the ethnic background for students who recently graduated from University of California - Riverside with a master's in visual & performing arts.
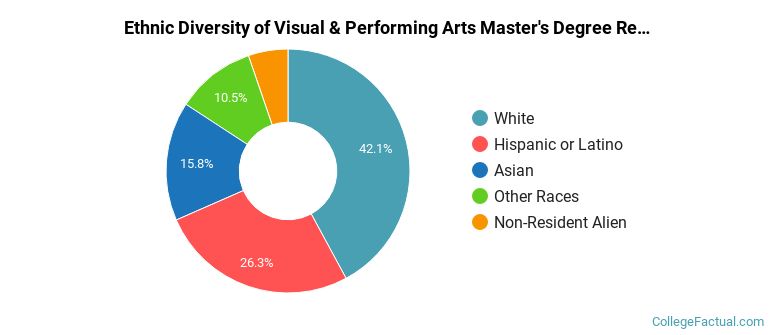
| Ethnic Background | Number of Students |
|---|---|
| Asian | 3 |
| Black or African American | 0 |
| Hispanic or Latino | 5 |
| White | 8 |
| Non-Resident Aliens | 1 |
| Other Races | 2 |
Take a look at the following statistics related to the make-up of the visual & performing arts majors at University of California - Riverside.
Visual & Performing Arts students may decide to major in one of the following focus areas. Individual majors may not be available for all degree levels.
| Major | Annual Graduates |
|---|---|
| Film, Video & Photographic Arts | 206 |
| Fine & Studio Arts | 59 |
| Music | 23 |
| Dance | 16 |
| General Visual & Performing Arts | 7 |
More about our data sources and methodologies.