Jump to any of the following sections:
The bachelor's program at CU - Boulder was ranked #72 on College Factual's Best Schools for engineering list. It is also ranked #2 in Colorado.
During the 2021-2022 academic year, University of Colorado Boulder handed out 891 bachelor's degrees in engineering. Last year, the same number of degrees were handed out.
In 2022, 482 students received their master’s degree in engineering from CU - Boulder. This makes it the #28 most popular school for engineering master’s degree candidates in the country.
In addition, 120 students received their doctoral degrees in engineering in 2022, making the school the #22 most popular school in the United States for this category of students.
Out-of-state part-time undergraduates at CU - Boulder paid an average of $1,680 per credit hour in 2022-2023. The average for in-state students was $616 per credit hour. The following table shows the average full-time tuition and fees for undergraduates.
| In State | Out of State | |
|---|---|---|
| Tuition | $13,910 | $40,297 |
| Fees | $1,646 | $1,646 |
| Books and Supplies | $1,200 | $1,200 |
| On Campus Room and Board | $16,950 | $16,950 |
| On Campus Other Expenses | $3,104 | $3,104 |
Learn more about CU - Boulder tuition and fees.
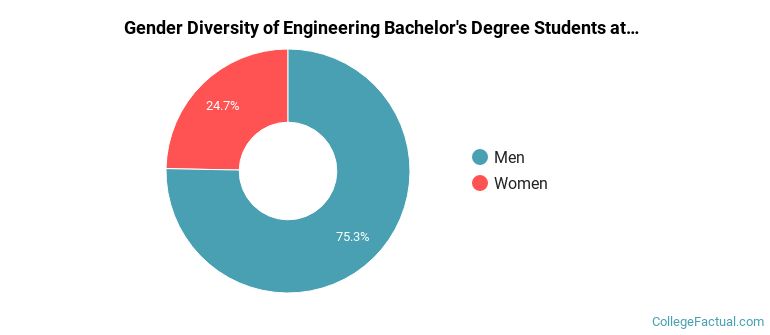
For the most recent academic year available, 75% of engineering bachelor's degrees went to men and 25% went to women.
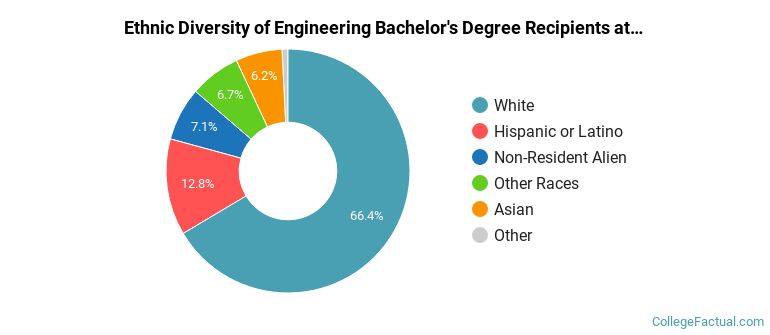
The majority of bachelor's degree recipients in this major at CU - Boulder are white. In the most recent graduating class for which data is available, 66% of students fell into this category.
The following table and chart show the ethnic background for students who recently graduated from University of Colorado Boulder with a bachelor's in engineering.
| Ethnic Background | Number of Students |
|---|---|
| Asian | 55 |
| Black or African American | 7 |
| Hispanic or Latino | 114 |
| White | 592 |
| Non-Resident Aliens | 63 |
| Other Races | 60 |
Online degrees for the CU - Boulder engineering bachelor’s degree program are not available at this time. To see if the school offers distance learning options in other areas, visit the CU - Boulder Online Learning page.
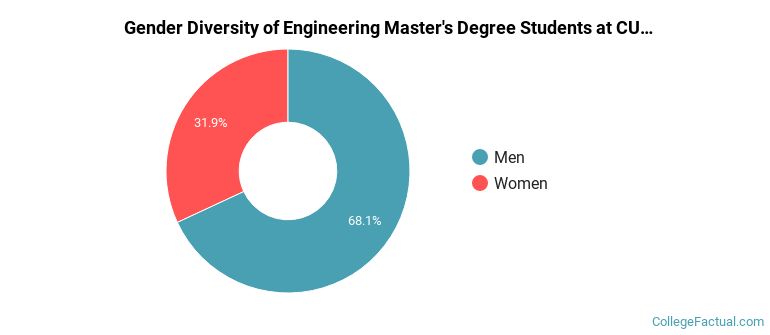
Of the 520 students who graduated with a Master’s in engineering from CU - Boulder in 2022, 68% were men and 32% were women.
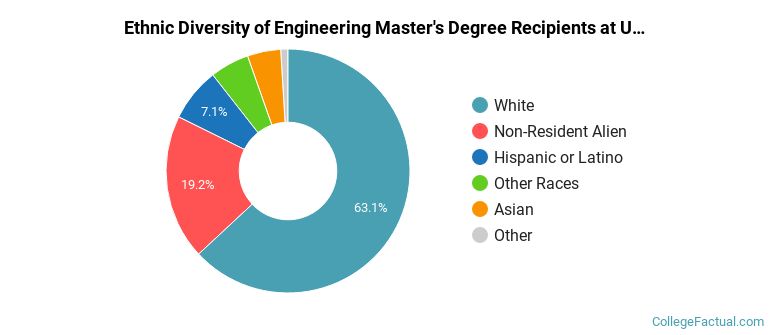
The majority of the students with this major are white. About 63% of 2022 graduates were in this category.
The following table and chart show the ethnic background for students who recently graduated from University of Colorado Boulder with a master's in engineering.
| Ethnic Background | Number of Students |
|---|---|
| Asian | 23 |
| Black or African American | 5 |
| Hispanic or Latino | 37 |
| White | 328 |
| Non-Resident Aliens | 100 |
| Other Races | 27 |
Take a look at the following statistics related to the make-up of the engineering majors at University of Colorado Boulder.
Engineering students may decide to major in one of the following focus areas. Individual majors may not be available for all degree levels.
| Major | Annual Graduates |
|---|---|
| Aerospace & Aeronautical Engineering | 374 |
| Mechanical Engineering | 341 |
| Electrical Engineering | 160 |
| Civil Engineering | 133 |
| General Engineering | 98 |
| Environmental Engineering | 93 |
| Chemical Engineering | 85 |
| Biochemical Engineering | 72 |
| Electrical and Computer Engineering. | 69 |
| Architectural Engineering | 66 |
| Materials Engineering | 34 |
| Engineering Physics | 18 |
| Biomedical Engineering | 12 |
| Related Major | Annual Graduates |
|---|---|
| Biological & Biomedical Sciences | 953 |
| Physical Sciences | 356 |
| Natural Resources & Conservation | 307 |
| Mathematics & Statistics | 244 |
| Architecture & Related Services | 150 |
More about our data sources and methodologies.