Jump to any of the following sections:
In College Factual's most recent rankings for the best schools for social sciences majors, U-M came in at #21. This puts it in the top 5% of the country in this field of study. It is also ranked #1 in Michigan.
During the 2021-2022 academic year, University of Michigan - Ann Arbor handed out 1049 bachelor's degrees in social sciences. This is a decrease of 3% over the previous year when 1,081 degrees were handed out.
In 2022, 120 students received their master’s degree in social sciences from U-M. This makes it the #28 most popular school for social sciences master’s degree candidates in the country.
In addition, 46 students received their doctoral degrees in social sciences in 2022, making the school the #20 most popular school in the United States for this category of students.
During the 2022-2023 academic year, part-time undergraduate students at U-M paid an average of $2,458 per credit hour if they came to the school from out-of-state. In-state students paid a discounted rate of $716 per credit hour. Information about average full-time undergraduate tuition and fees is shown in the table below.
| In State | Out of State | |
|---|---|---|
| Tuition | $17,977 | $59,775 |
| Fees | $332 | $332 |
| Books and Supplies | $1,126 | $1,126 |
| On Campus Room and Board | $13,856 | $13,856 |
| On Campus Other Expenses | $2,572 | $2,572 |
Learn more about U-M tuition and fees.
During the 2021-2022 academic year, 1,049 students graduated with a bachelor's degree in social sciences from U-M. About 56% were men and 44% were women.

The majority of bachelor's degree recipients in this major at U-M are white. In the most recent graduating class for which data is available, 59% of students fell into this category.
The following table and chart show the ethnic background for students who recently graduated from University of Michigan - Ann Arbor with a bachelor's in social sciences.

| Ethnic Background | Number of Students |
|---|---|
| Asian | 96 |
| Black or African American | 30 |
| Hispanic or Latino | 72 |
| White | 618 |
| Non-Resident Aliens | 140 |
| Other Races | 93 |
U-M does not offer an online option for its social sciences bachelor’s degree program at this time. To see if the school offers distance learning options in other areas, visit the U-M Online Learning page.
During the 2021-2022 academic year, 75 students graduated with a master's degree in social sciences from U-M. About 41% were men and 59% were women.

The following table and chart show the ethnic background for students who recently graduated from University of Michigan - Ann Arbor with a master's in social sciences.
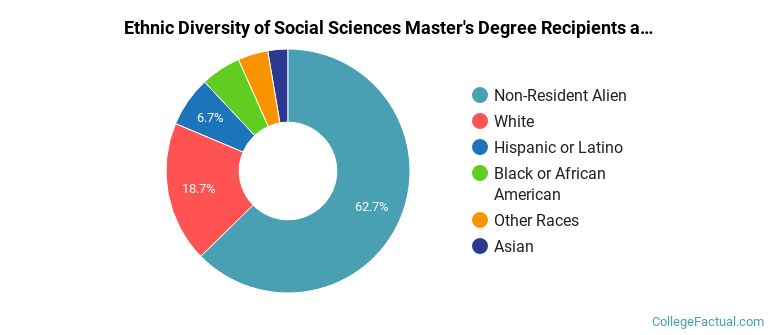
| Ethnic Background | Number of Students |
|---|---|
| Asian | 2 |
| Black or African American | 4 |
| Hispanic or Latino | 5 |
| White | 14 |
| Non-Resident Aliens | 47 |
| Other Races | 3 |
Take a look at the following statistics related to the make-up of the social sciences majors at University of Michigan - Ann Arbor.
Social Sciences students may decide to major in one of the following focus areas. Individual majors may not be available for all degree levels.
| Major | Annual Graduates |
|---|---|
| Economics | 690 |
| Political Science & Government | 254 |
| Sociology | 146 |
| Anthropology | 73 |
| General Social Sciences | 11 |
| Related Major | Annual Graduates |
|---|---|
| Communication & Journalism | 260 |
| Foreign Languages & Linguistics | 241 |
| English Language & Literature | 169 |
| History | 132 |
| Area, Ethnic, Culture, & Gender Studies | 113 |
More about our data sources and methodologies.