Go directly to any of the following sections:
The bachelor's program at UNG was ranked #542 on College Factual's Best Schools for social sciences list. It is also ranked #13 in Georgia.
| Ranking Type | Rank |
|---|---|
| Best Social Sciences Bachelor’s Degree Schools | 517 |
| Best Social Sciences Schools | 542 |
During the 2021-2022 academic year, University of North Georgia handed out 116 bachelor's degrees in social sciences. This is an increase of 22% over the previous year when 95 degrees were handed out.
In 2022, 7 students received their master’s degree in social sciences from UNG. This makes it the #322 most popular school for social sciences master’s degree candidates in the country.
During the 2022-2023 academic year, part-time undergraduate students at UNG paid an average of $624 per credit hour if they came to the school from out-of-state. In-state students paid a discounted rate of $176 per credit hour. The following table shows the average full-time tuition and fees for undergraduates.
| In State | Out of State | |
|---|---|---|
| Tuition | $4,230 | $14,986 |
| Fees | $981 | $981 |
| Books and Supplies | $1,460 | $1,460 |
| On Campus Room and Board | $12,310 | $12,310 |
| On Campus Other Expenses | $3,680 | $3,680 |
Learn more about UNG tuition and fees.
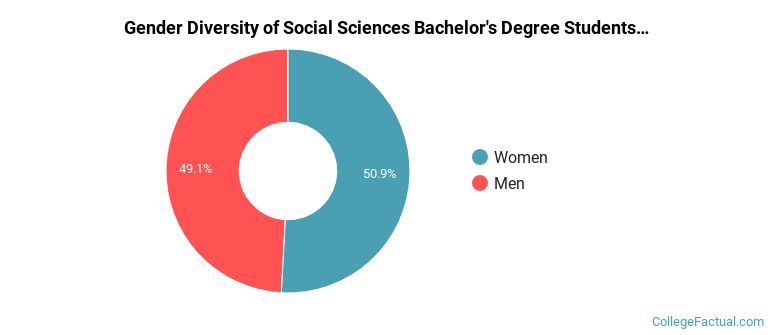
Of the 116 students who earned a bachelor's degree in Social Sciences from UNG in 2021-2022, 49% were men and 51% were women.
The majority of bachelor's degree recipients in this major at UNG are white. In the most recent graduating class for which data is available, 72% of students fell into this category.
The following table and chart show the ethnic background for students who recently graduated from University of North Georgia with a bachelor's in social sciences.
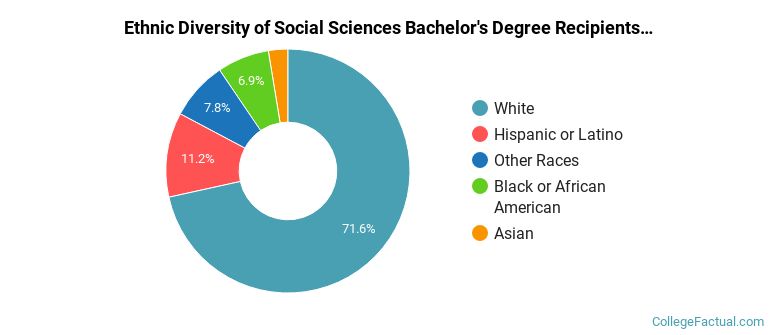
| Ethnic Background | Number of Students |
|---|---|
| Asian | 3 |
| Black or African American | 8 |
| Hispanic or Latino | 13 |
| White | 83 |
| Non-Resident Aliens | 0 |
| Other Races | 9 |
UNG does not offer an online option for its social sciences bachelor’s degree program at this time. To see if the school offers distance learning options in other areas, visit the UNG Online Learning page.
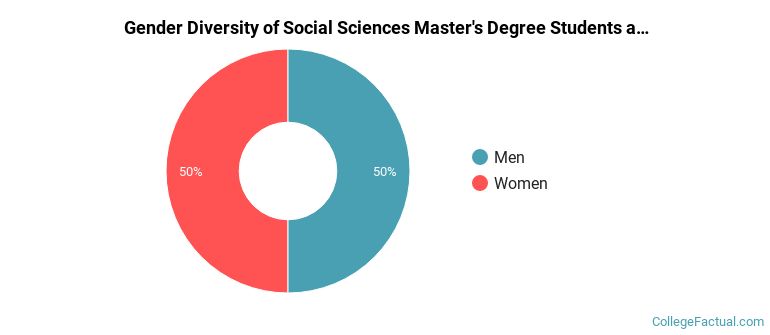
For the most recent academic year available, 50% of social sciences master's degrees went to men and 50% went to women.
The majority of master's degree recipients in this major at UNG are white. In the most recent graduating class for which data is available, 100% of students fell into this category.
The following table and chart show the ethnic background for students who recently graduated from University of North Georgia with a master's in social sciences.
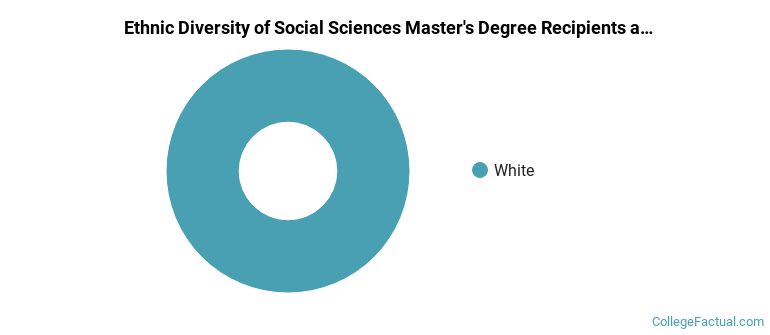
| Ethnic Background | Number of Students |
|---|---|
| Asian | 0 |
| Black or African American | 0 |
| Hispanic or Latino | 0 |
| White | 2 |
| Non-Resident Aliens | 0 |
| Other Races | 0 |
Take a look at the following statistics related to the make-up of the social sciences majors at University of North Georgia.
Social Sciences students may decide to major in one of the following focus areas. Individual majors may not be available for all degree levels.
| Major | Annual Graduates |
|---|---|
| Political Science & Government | 54 |
| Sociology | 35 |
| International Relations & National Security | 30 |
| Geography & Cartography | 13 |
| Related Major | Annual Graduates |
|---|---|
| Liberal Arts / Sciences & Humanities | 716 |
| Communication & Journalism | 116 |
| History | 59 |
| English Language & Literature | 31 |
| Foreign Languages & Linguistics | 29 |