Here, you'll find out more about the major, including such details as the number of graduates, what degree levels are offered, ethnicity of students, average salaries, and more. Also, learn how UVU ranks among other schools offering degrees in music.
Jump to any of the following sections:
Learn about start dates, transferring credits, availability of financial aid, and more by contacting the universities below.
Earn the music business degree that fits into the business world – and partners Southern New Hampshire University with world-renowned Berklee College of Music.
The bachelor's program at UVU was ranked #312 on College Factual's Best Schools for music list. It is also ranked #5 in Utah.
| Ranking Type | Rank |
|---|---|
| Best Music Bachelor’s Degree Schools | 299 |
| Best Music Schools | 312 |
During the 2021-2022 academic year, Utah Valley University handed out 18 bachelor's degrees in music. This is an increase of 13% over the previous year when 16 degrees were handed out.
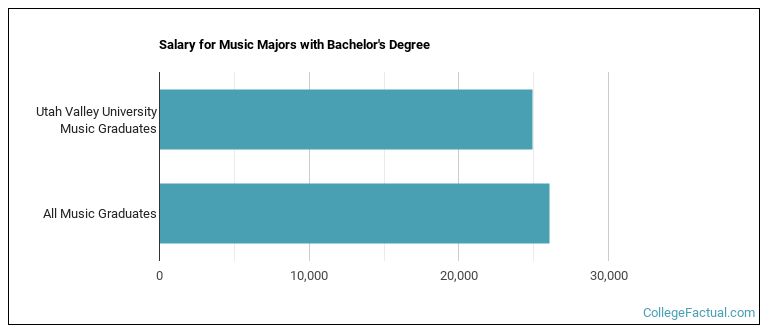
The median salary of music students who receive their bachelor's degree at UVU is $24,952. This is less than $26,036, which is the national median of all music majors in the nation who earn bachelor's degrees.
In 2022-2023, the average part-time undergraduate tuition at UVU was $716 per credit hour for out-of-state students. The average for in-state students was $234 per credit hour. The average full-time tuition and fees for undergraduates are shown in the table below.
| In State | Out of State | |
|---|---|---|
| Tuition | $5,614 | $17,174 |
| Fees | $656 | $656 |
| Books and Supplies | $670 | $670 |
Learn more about UVU tuition and fees.
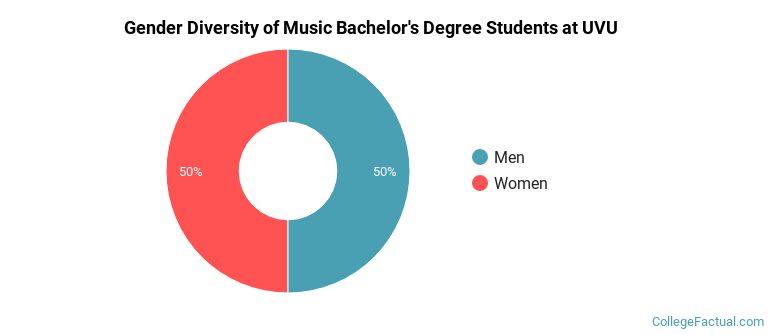
In the 2021-2022 academic year, 18 students earned a bachelor's degree in music from UVU. About 50% of these graduates were women and the other 50% were men.
The majority of bachelor's degree recipients in this major at UVU are white. In the most recent graduating class for which data is available, 89% of students fell into this category.
The following table and chart show the ethnic background for students who recently graduated from Utah Valley University with a bachelor's in music.
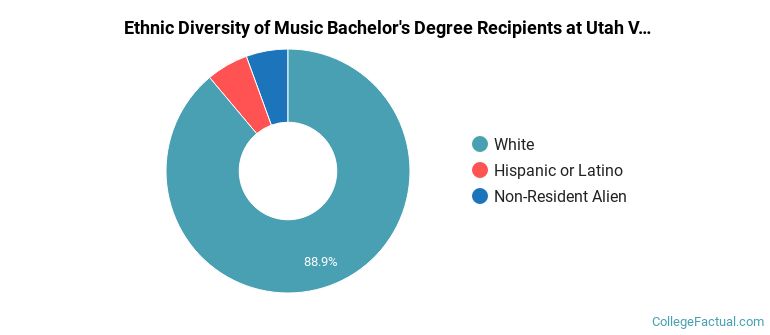
| Ethnic Background | Number of Students |
|---|---|
| Asian | 0 |
| Black or African American | 0 |
| Hispanic or Latino | 1 |
| White | 16 |
| Non-Resident Aliens | 1 |
| Other Races | 0 |
Online degrees for the UVU music bachelor’s degree program are not available at this time. To see if the school offers distance learning options in other areas, visit the UVU Online Learning page.
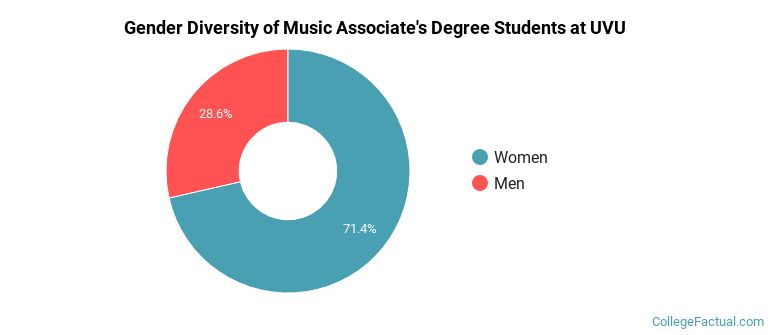
Of the 7 students who graduated with a Associate’s in music from UVU in 2022, 29% were men and 71% were women.
The majority of associate's degree recipients in this major at UVU are white. In the most recent graduating class for which data is available, 71% of students fell into this category.
The following table and chart show the ethnic background for students who recently graduated from Utah Valley University with a associate's in music.
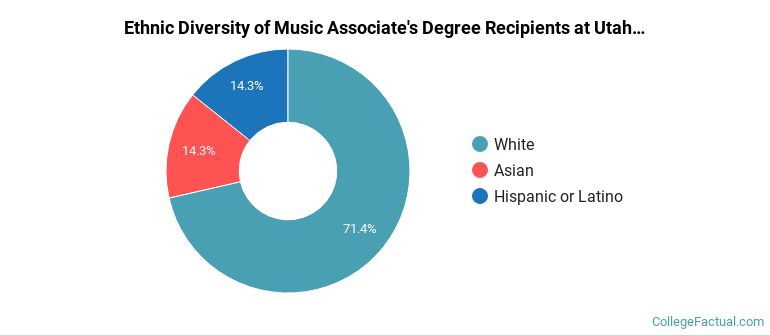
| Ethnic Background | Number of Students |
|---|---|
| Asian | 1 |
| Black or African American | 0 |
| Hispanic or Latino | 1 |
| White | 5 |
| Non-Resident Aliens | 0 |
| Other Races | 0 |
Take a look at the following statistics related to the make-up of the music majors at Utah Valley University.
| Related Major | Annual Graduates |
|---|---|
| Design & Applied Arts | 454 |
| Film, Video & Photographic Arts | 225 |
| Drama & Theater Arts | 32 |
| Dance | 31 |
| Fine & Studio Arts | 7 |
More about our data sources and methodologies.
