Here, you'll find out more about the major, including such details as the number of graduates, what degree levels are offered, ethnicity of students, average salaries, and more. In addition, we cover how Virginia Tech ranks in comparison to other schools with political science programs.
Go directly to any of the following sections:
Learn about start dates, transferring credits, availability of financial aid, and more by contacting the universities below.
Gain a solid understanding of American political history, the current political landscape, and the major political parties with this online bachelor's from Southern New Hampshire University.
Virginia Tech is in the top 10% of the country for political science. More specifically it was ranked #41 out of 591 schools by College Factual. It is also ranked #2 in Virginia.
During the 2021-2022 academic year, Virginia Tech handed out 185 bachelor's degrees in political science & government. Last year, the same number of degrees were handed out.
In 2022, 13 students received their master’s degree in political science from Virginia Tech. This makes it the #29 most popular school for political science master’s degree candidates in the country.
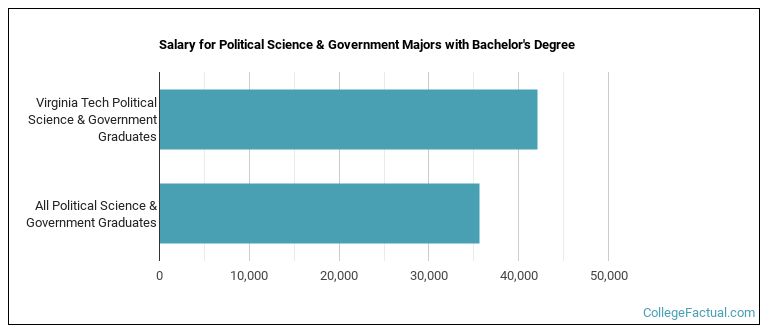
The median salary of political science students who receive their bachelor's degree at Virginia Tech is $42,114. This is great news for graduates of the program, since this figure is higher than the national average of $35,631 for all political science bachelor's degree recipients.
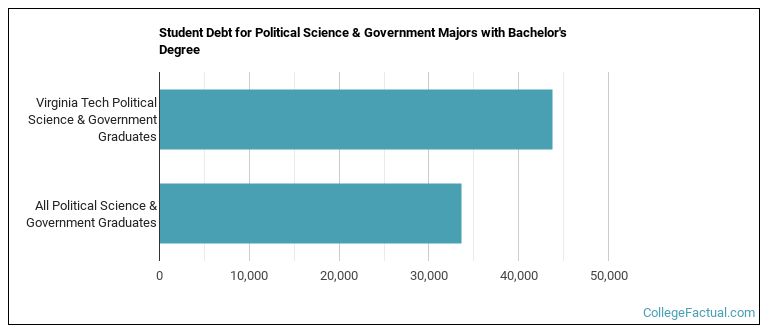
While getting their bachelor's degree at Virginia Tech, political science students borrow a median amount of $43,730 in student loans. This is higher than the the typical median of $33,583 for all political science majors across the country.
The typical student loan payment of a bachelor's degree student from the political science program at Virginia Tech is $434 per month.
During the 2022-2023 academic year, part-time undergraduate students at Virginia Tech paid an average of $1,388 per credit hour if they came to the school from out-of-state. In-state students paid a discounted rate of $529 per credit hour. The following table shows the average full-time tuition and fees for undergraduates.
| In State | Out of State | |
|---|---|---|
| Tuition | $12,698 | $33,310 |
| Fees | $2,780 | $3,384 |
| Books and Supplies | $2,620 | $2,620 |
| On Campus Room and Board | $14,888 | $14,888 |
| On Campus Other Expenses | $4,266 | $4,266 |
Learn more about Virginia Tech tuition and fees.
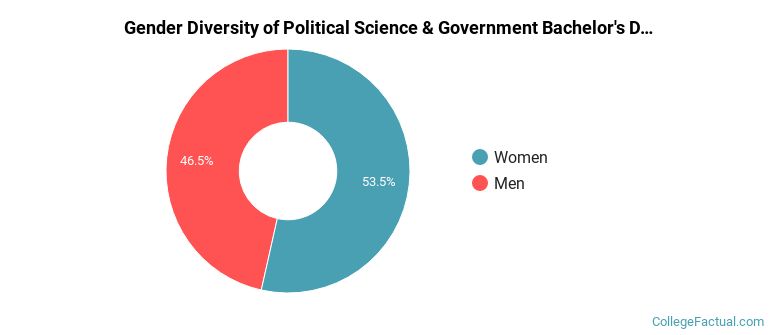
In the 2021-2022 academic year, 185 students earned a bachelor's degree in political science from Virginia Tech. About 54% of these graduates were women and the other 46% were men.
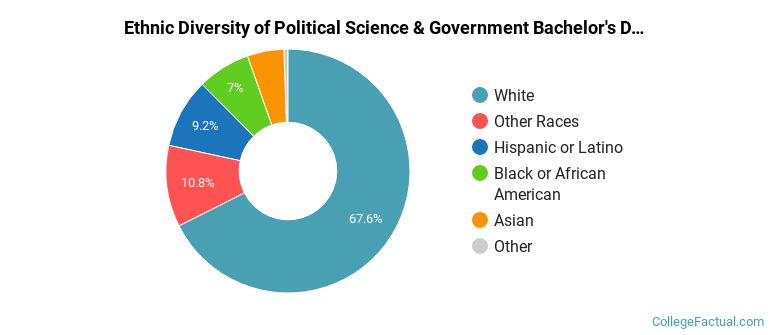
The majority of bachelor's degree recipients in this major at Virginia Tech are white. In the most recent graduating class for which data is available, 68% of students fell into this category.
The following table and chart show the ethnic background for students who recently graduated from Virginia Tech with a bachelor's in political science.
| Ethnic Background | Number of Students |
|---|---|
| Asian | 9 |
| Black or African American | 13 |
| Hispanic or Latino | 17 |
| White | 125 |
| Non-Resident Aliens | 1 |
| Other Races | 20 |
Online degrees for the Virginia Tech political science bachelor’s degree program are not available at this time. To see if the school offers distance learning options in other areas, visit the Virginia Tech Online Learning page.
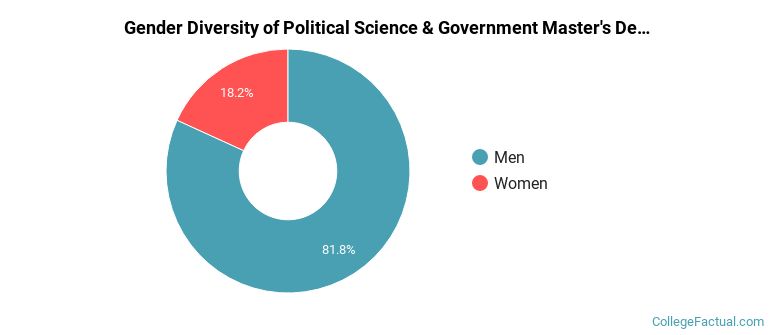
In the 2021-2022 academic year, 11 students earned a master's degree in political science from Virginia Tech. About 18% of these graduates were women and the other 82% were men.
The majority of the students with this major are white. About 73% of 2022 graduates were in this category.
The following table and chart show the ethnic background for students who recently graduated from Virginia Tech with a master's in political science.
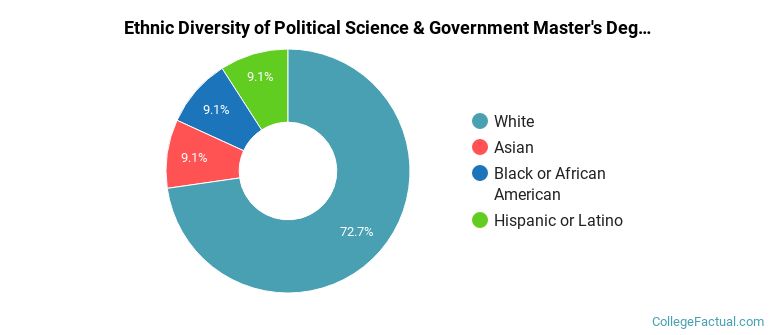
| Ethnic Background | Number of Students |
|---|---|
| Asian | 1 |
| Black or African American | 1 |
| Hispanic or Latino | 1 |
| White | 8 |
| Non-Resident Aliens | 0 |
| Other Races | 0 |
Take a look at the following statistics related to the make-up of the political science majors at Virginia Tech.
| Related Major | Annual Graduates |
|---|---|
| Sociology | 215 |
| International Relations & National Security | 132 |
| Economics | 97 |
| Geography & Cartography | 54 |
| Urban Studies | 11 |
More about our data sources and methodologies.
