We've pulled together some essential information you should know about the program, including how many students graduate each year, the ethnic diversity of these students, average starting salaries, and more. Also, learn how Wartburg ranks among other schools offering degrees in general business.
Go directly to any of the following sections:
The bachelor's program at Wartburg was ranked #82 on College Factual's Best Schools for general business list. It is also ranked #1 in Iowa.
| Ranking Type | Rank |
|---|---|
| Best General Business/Commerce Bachelor’s Degree Schools | 55 |
| Best General Business/Commerce Schools | 82 |
During the 2021-2022 academic year, Wartburg College handed out 76 bachelor's degrees in general business/commerce. This is an increase of 27% over the previous year when 60 degrees were handed out.
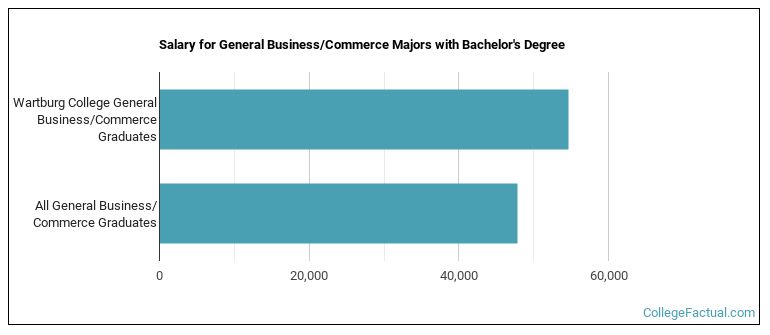
The median salary of general business students who receive their bachelor's degree at Wartburg is $54,652. This is great news for graduates of the program, since this figure is higher than the national average of $47,842 for all general business bachelor's degree recipients.
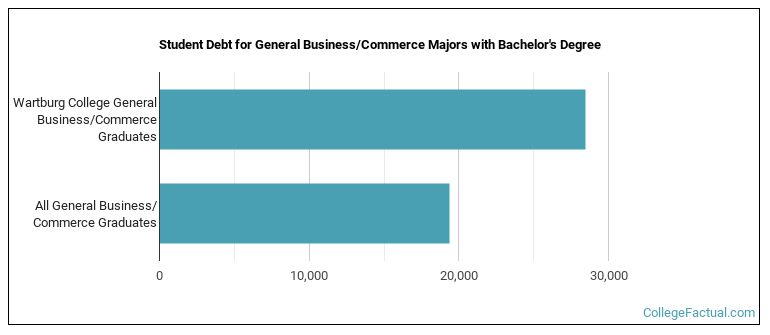
While getting their bachelor's degree at Wartburg, general business students borrow a median amount of $28,443 in student loans. This is higher than the the typical median of $19,374 for all general business majors across the country.
The typical student loan payment of a bachelor's degree student from the general business program at Wartburg is $268 per month.
During the 2022-2023 academic year, part-time undergraduate students at Wartburg paid an average of $2,800 per credit hour. No discount was available for in-state students. The following table shows the average full-time tuition and fees for undergraduates.
| In State | Out of State | |
|---|---|---|
| Tuition | $48,490 | $48,490 |
| Fees | $2,550 | $2,550 |
| Books and Supplies | $1,100 | $1,100 |
| On Campus Room and Board | $11,062 | $11,062 |
| On Campus Other Expenses | $1,300 | $1,300 |
Learn more about Wartburg tuition and fees.
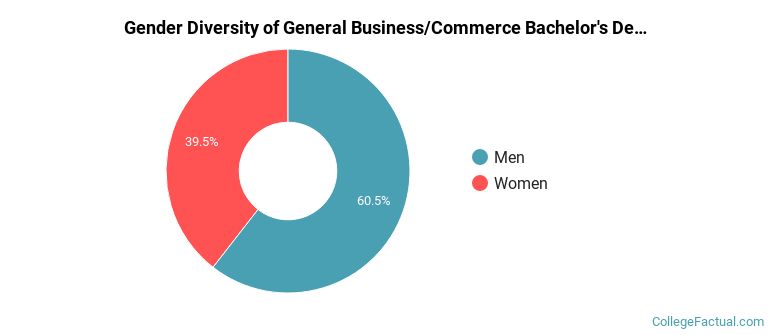
Of the 76 students who graduated with a Bachelor’s in general business from Wartburg in 2022, 61% were men and 39% were women.
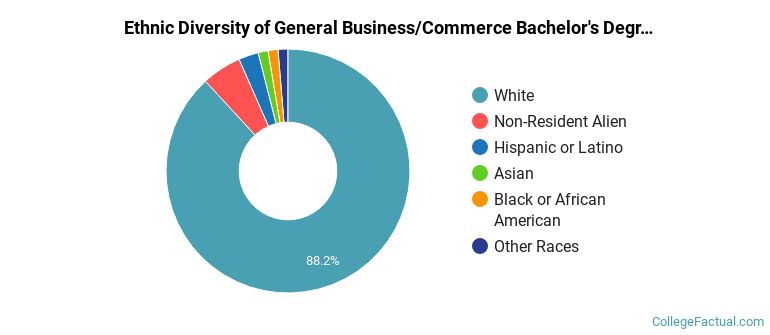
The majority of bachelor's degree recipients in this major at Wartburg are white. In the most recent graduating class for which data is available, 88% of students fell into this category.
The following table and chart show the ethnic background for students who recently graduated from Wartburg College with a bachelor's in general business.
| Ethnic Background | Number of Students |
|---|---|
| Asian | 1 |
| Black or African American | 1 |
| Hispanic or Latino | 2 |
| White | 67 |
| Non-Resident Aliens | 4 |
| Other Races | 1 |
Online degrees for the Wartburg general business bachelor’s degree program are not available at this time. To see if the school offers distance learning options in other areas, visit the Wartburg Online Learning page.
Take a look at the following statistics related to the make-up of the general business majors at Wartburg College.
| Related Major | Annual Graduates |
|---|---|
| Accounting | 14 |
| Management Sciences & Quantitative Methods | 6 |
More about our data sources and methodologies.