Here, you'll find out more about the major, including such details as the number of graduates, what degree levels are offered, ethnicity of students, average salaries, and more. We've also included details on how William Paterson University ranks compared to other colleges offering a major in liberal arts.
Jump to any of the following sections:
The bachelor's program at William Paterson University was ranked #210 on College Factual's Best Schools for liberal arts list. It is also ranked #5 in New Jersey.
| Ranking Type | Rank |
|---|---|
| Best Liberal Arts General Studies Bachelor’s Degree Schools | 119 |
| Best Liberal Arts General Studies Schools | 210 |
During the 2021-2022 academic year, William Paterson University of New Jersey handed out 68 bachelor's degrees in liberal arts general studies. Last year, the same number of degrees were handed out.
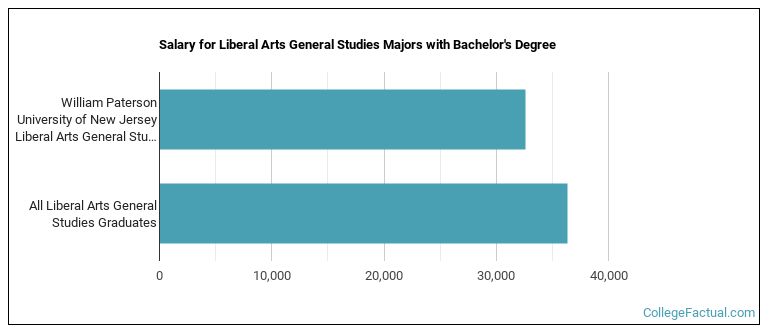
The median salary of liberal arts students who receive their bachelor's degree at William Paterson University is $32,581. This is less than $36,340, which is the national median of all liberal arts majors in the nation who earn bachelor's degrees.
Learn about other programs related to Liberal Arts General Studies that might interest you.
Maximize your transfer credits and complete your bachelor's degree faster with this flexible online bachelor's from Southern New Hampshire University.
Out-of-state part-time undergraduates at William Paterson University paid an average of $778 per credit hour in 2022-2023. The average for in-state students was $471 per credit hour. The average full-time tuition and fees for undergraduates are shown in the table below.
| In State | Out of State | |
|---|---|---|
| Tuition | $14,690 | $24,004 |
| Fees | $460 | $460 |
| Books and Supplies | $1,600 | $1,600 |
| On Campus Room and Board | $15,990 | $15,990 |
| On Campus Other Expenses | $3,140 | $3,140 |
Learn more about William Paterson University tuition and fees.
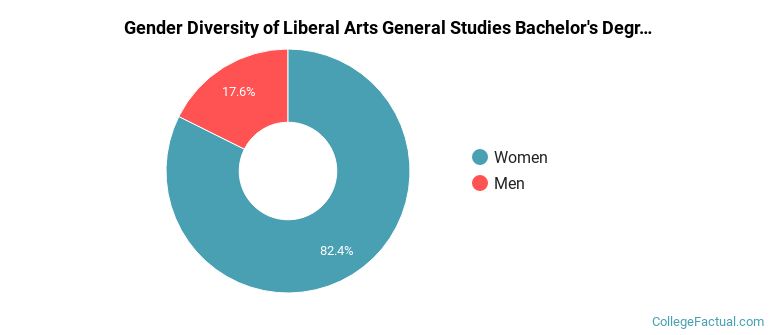
Of the 68 students who graduated with a Bachelor’s in liberal arts from William Paterson University in 2022, 18% were men and 82% were women.
The following table and chart show the ethnic background for students who recently graduated from William Paterson University of New Jersey with a bachelor's in liberal arts.
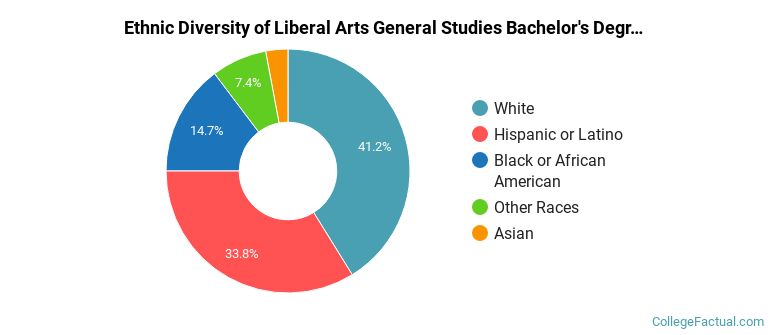
| Ethnic Background | Number of Students |
|---|---|
| Asian | 2 |
| Black or African American | 10 |
| Hispanic or Latino | 23 |
| White | 28 |
| Non-Resident Aliens | 0 |
| Other Races | 5 |
William Paterson University does not offer an online option for its liberal arts bachelor’s degree program at this time. To see if the school offers distance learning options in other areas, visit the William Paterson University Online Learning page.
Take a look at the following statistics related to the make-up of the liberal arts majors at William Paterson University of New Jersey.
More about our data sources and methodologies.
