Here, you'll find out more about the major, including such details as the number of graduates, what degree levels are offered, ethnicity of students, average salaries, and more. We've also included details on how UIUC ranks compared to other colleges offering a major in ce.
Jump to any of the following sections:
In College Factual's most recent rankings for the best schools for ce majors, UIUC came in at #6. This puts it in the top 5% of the country in this field of study. It is also ranked #2 in Illinois.
| Ranking Type | Rank |
|---|---|
| Best Computer Engineering Schools | 6 |
| Best Computer Engineering Bachelor’s Degree Schools | 7 |
During the 2021-2022 academic year, University of Illinois at Urbana-Champaign handed out 318 bachelor's degrees in computer engineering. This is a decrease of 25% over the previous year when 422 degrees were handed out.
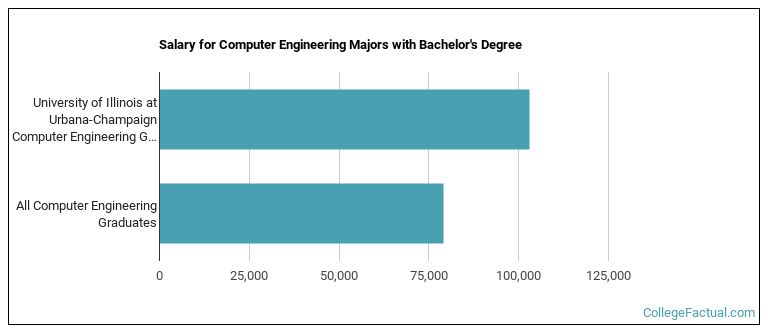
The median salary of ce students who receive their bachelor's degree at UIUC is $103,123. This is great news for graduates of the program, since this figure is higher than the national average of $78,964 for all ce bachelor's degree recipients.
The typical student loan payment of a bachelor's degree student from the ce program at UIUC is $626 per month.
Out-of-state part-time undergraduates at UIUC paid an average of $1,019 per credit hour in 2022-2023. The average for in-state students was $601 per credit hour. The following table shows the average full-time tuition and fees for undergraduates.
| In State | Out of State | |
|---|---|---|
| Tuition | $14,768 | $35,900 |
| Fees | $3,292 | $3,292 |
| Books and Supplies | $1,200 | $1,200 |
| On Campus Room and Board | $13,938 | $13,938 |
| On Campus Other Expenses | $2,500 | $2,500 |
Learn more about UIUC tuition and fees.
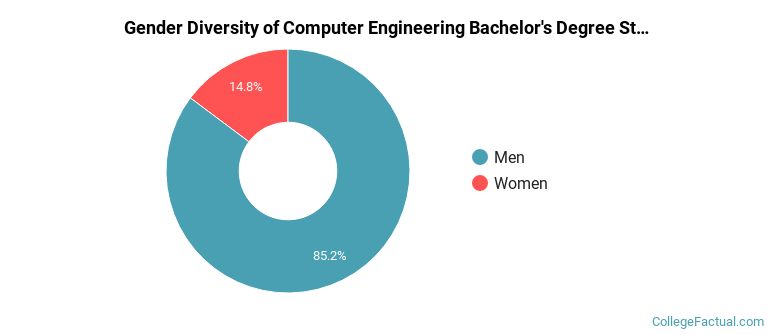
During the 2021-2022 academic year, 318 students graduated with a bachelor's degree in ce from UIUC. About 85% were men and 15% were women.
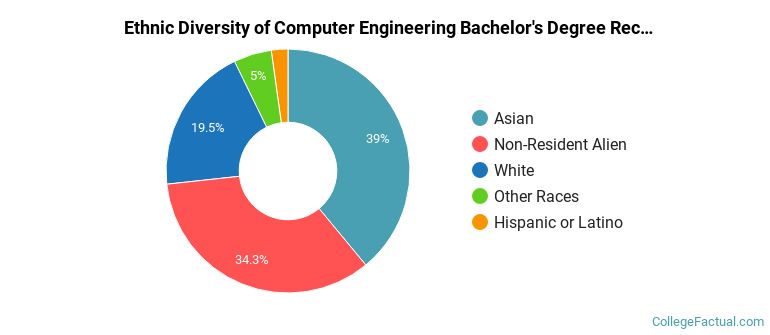
The following table and chart show the ethnic background for students who recently graduated from University of Illinois at Urbana-Champaign with a bachelor's in ce.
| Ethnic Background | Number of Students |
|---|---|
| Asian | 124 |
| Black or African American | 0 |
| Hispanic or Latino | 7 |
| White | 62 |
| Non-Resident Aliens | 109 |
| Other Races | 16 |
UIUC does not offer an online option for its ce bachelor’s degree program at this time. To see if the school offers distance learning options in other areas, visit the UIUC Online Learning page.
Take a look at the following statistics related to the make-up of the ce majors at University of Illinois at Urbana-Champaign.
| Related Major | Annual Graduates |
|---|---|
| Mechanical Engineering | 370 |
| Electrical Engineering | 357 |
| Civil Engineering | 313 |
| Chemical Engineering | 189 |
| Aerospace & Aeronautical Engineering | 168 |
More about our data sources and methodologies.